The numbers are in!
Have you ever wondered how the 2nd Ward performed in Philadelphia when compared to other Wards? How about your particular Division? Well, the official voter file is in and we’ve crunched the numbers.
Important notes:
- All statistics have been rounded up or down. So, some numbers may appear to be a statistical dead heat.
- All charts reflect registered Democrats.
So, let’s dive in…
% Turnout

We beat the City % turnout by almost 18%. And compared to the last mid-term Primary, our voter turnout increased by 10%, double the rate of Philadelphia. Check out the Leaderboard below for where we finished City-wide.
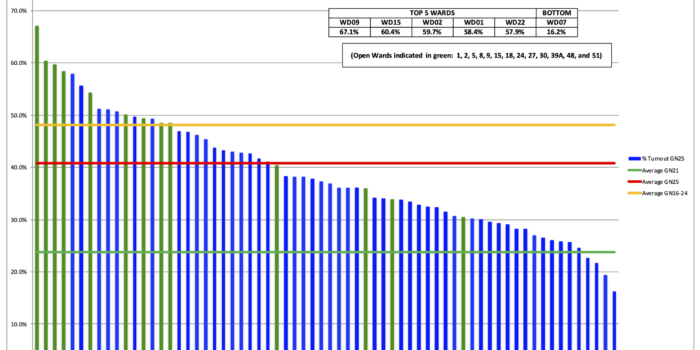
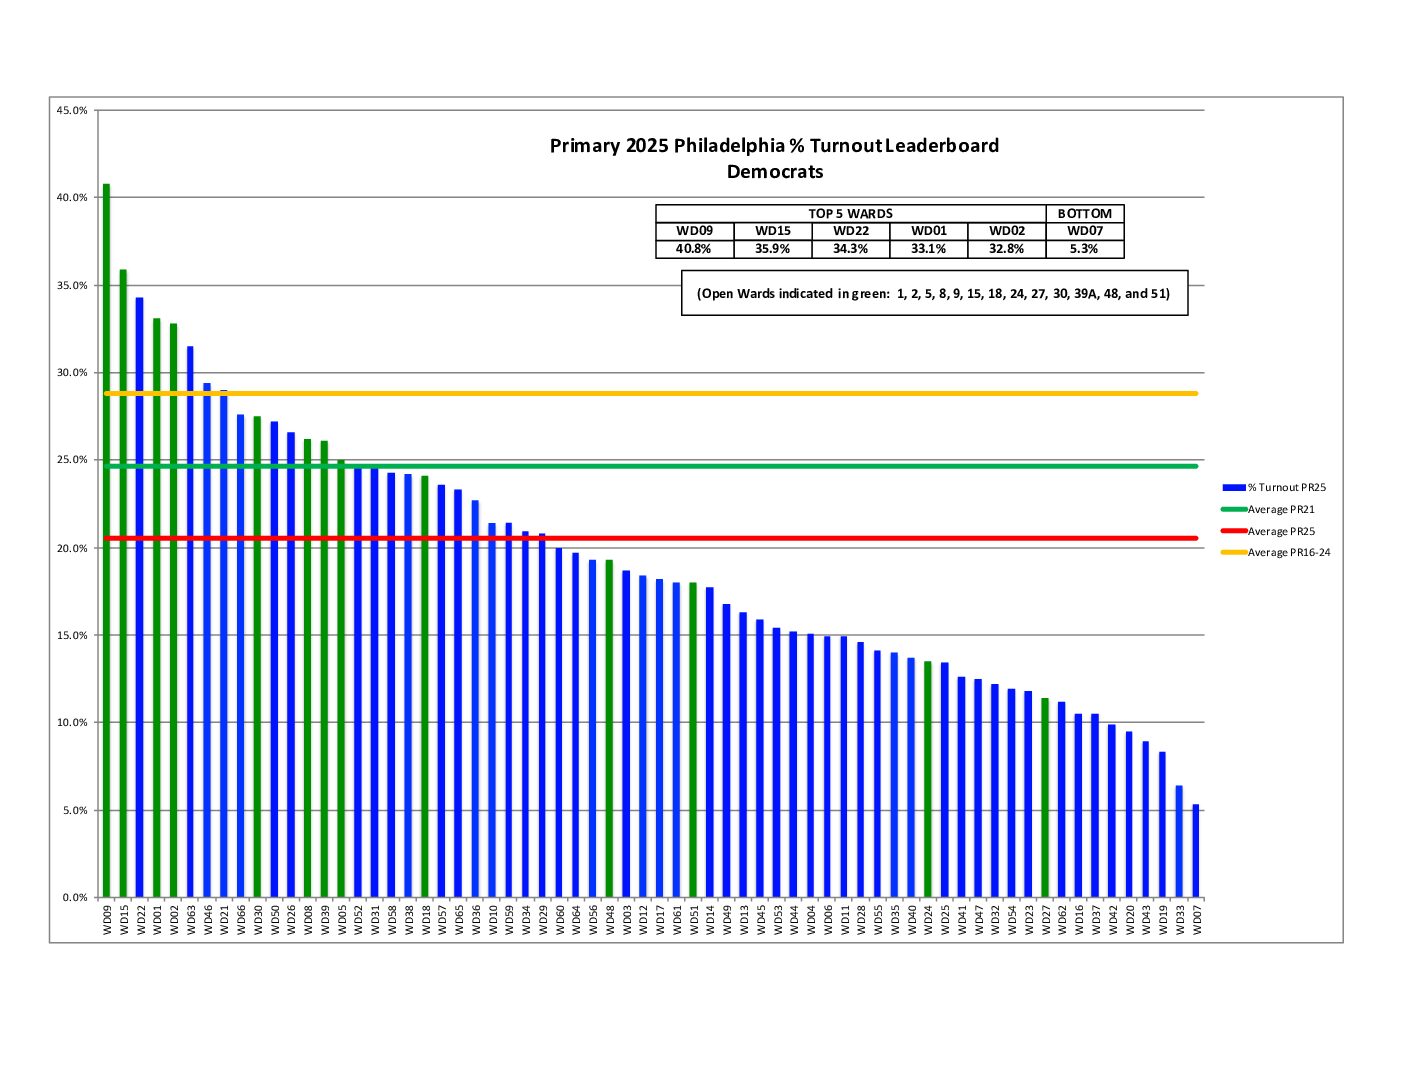
% Turnout Leaderboard

We were almost exactly tied with Ward 1 for 4th place, which maintains our momentum from the last election. We were within 3 percentage points of Ward 15, which came in 2nd.
Endorsements

Here’s how our endorsed candidates finished (within the 2nd Ward):
- John Fetterman bested our endorsed candidate Malcolm Kenyatta for US Senate.
- Endorsed Josh Shapiro was unopposed.
- Brian Sims beat endorsed Austin Davis by a slim margin for Lt Governor.
- Endorsed Dwight Evans won for 3rd US Congressional District Representative.
- Endorsed Mary Isaacson was unopposed.
- Endorsed Will Gross won for 182nd State House District Representative.
- We recommended voting YES on the ballot questions, all of which passed.
You can check our our endorsements here.
2nd Ward and City Turnout History


Both the 2nd Ward and City continue their histories of increasing both raw votes and percent voter turnout. (2020 was a significant outlier, but it shows what we can do!)
% and Raw Turnout compared to average of PR17 through PR21


The City stayed consistent in percent voter turnout compared to the average of Primaries 2017-2021. The 2nd Ward showed a 3.5% increase.
In terms of raw voter turnout, the City showed a 6% increase compared to a 19% increase by the 2nd Ward over this period. (Both the City and 2nd Ward increased raw turnout over the 2018 Primary by 48% and 60% respectively.)
One thing to keep in mind about the average Primary turnout of 2017-2021 is that 2020 was a year of historically high voter turnout. That tended to skew the statistics on the high side. But, even with 2020, the City is meeting, and the 2nd Ward is exceeding, those averages.
Turnout Voting Method

This shows the raw number of votes cast per Ward broken into Mail, At Polls, Absentee, and Provisional. The 2nd Ward essentially matched the City in terms of voting method.
Turnout Voting Method comparison PR21 to PR22

It looks like voting method is starting to stabilize as pandemic restrictions, and fears, ease. These may be very close to how voters will continue to choose to vote going forward.
Anecdotally, when some of us talked with voters door to door, many people equated mail in voting with a bad thing they had to do because of the pandemic. Many wanted to vote in person as a marker of life getting back to normal. There is clearly some human behavior at work here.
% voted early

- Mail-in voting, Civilian overseas, Absentee
- Any voting method other than At Polls (AP)
% Mail-in Ballots spoiled

% Mail-in Ballots Unreturned

% Change in Turnout between PR21 and PR22

If we look at % Change in Turnout between PR21 and PR22, voter turnout was up 10% with the 2nd Ward at 11%.
Now, check out how the different Divisions stacked up within the 2nd Ward.
Related Posts