The numbers are in!
Have you ever wondered how your division performed in Philadelphia’s 2nd Ward when compared to other divisions? (What’s my division?) Well, the official voter file is in and we’ve crunched the numbers. (Don’t forget to check out how the ward performed city-wide if you haven’t already.)
Important notes:
- All statistics have been rounded up or down. So, some numbers may appear to be a statistical dead heat.
- All charts reflect registered Democrats.
So, let’s dive in…
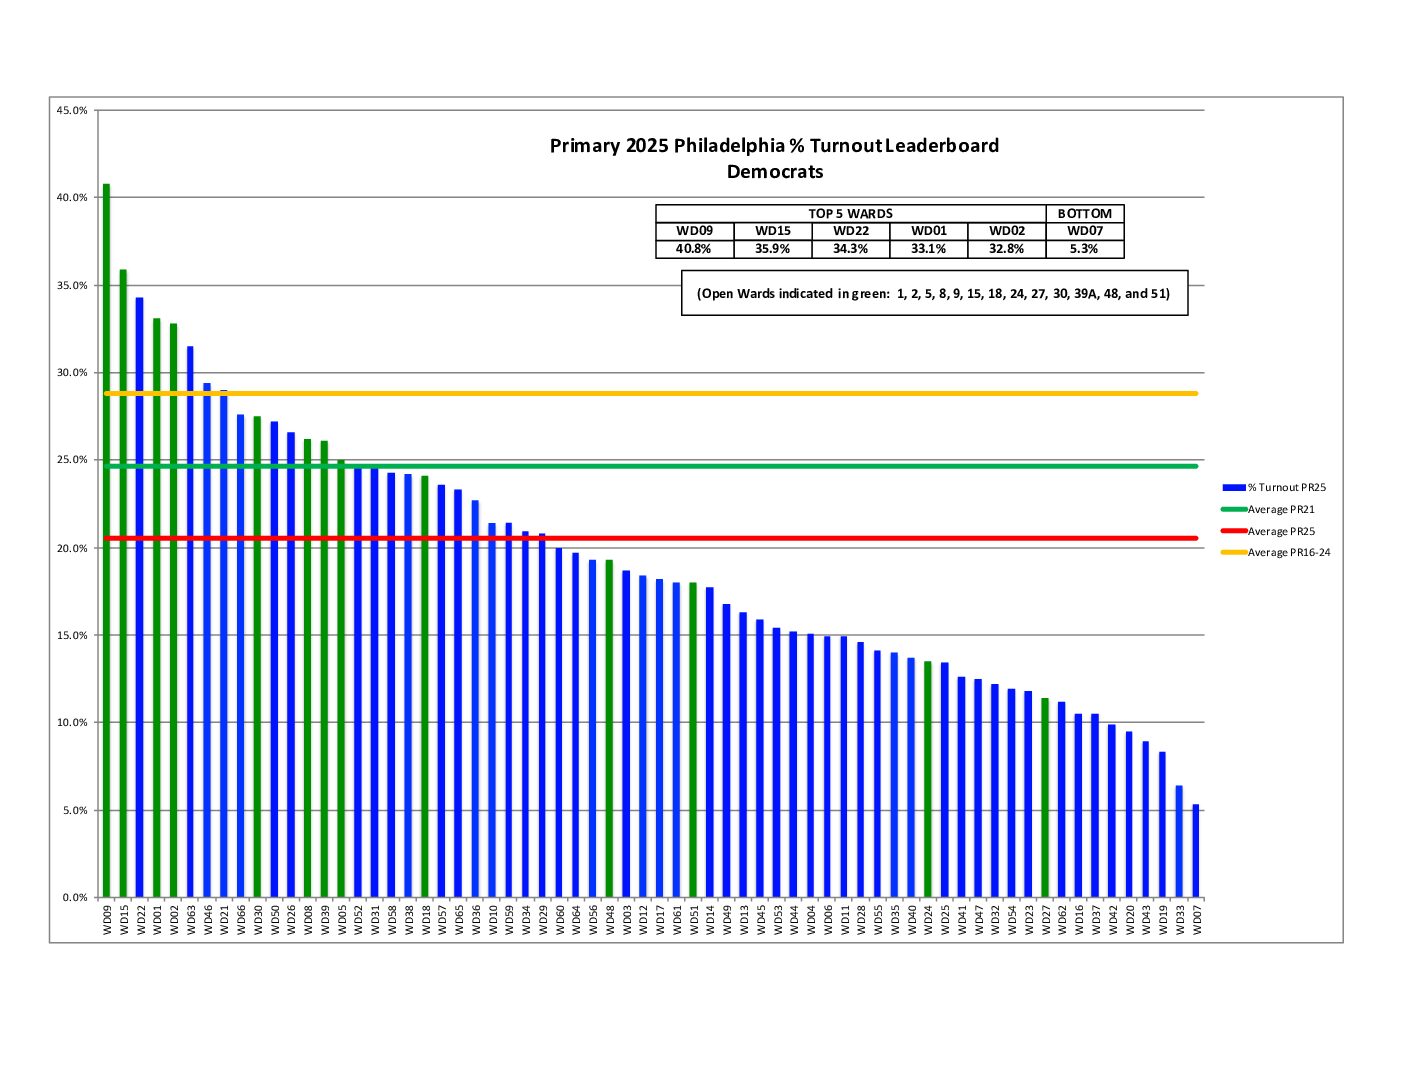
% Turnout

Almost every division beat the city average!

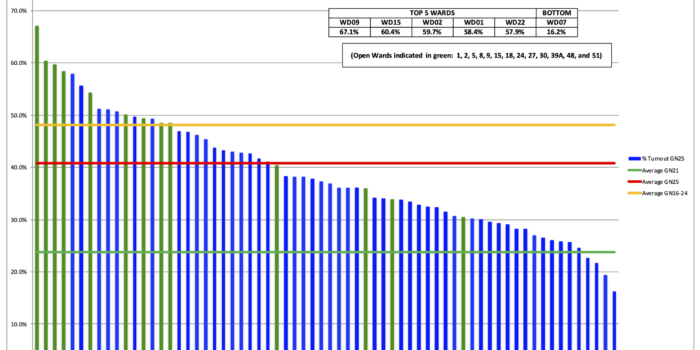
% and Raw Turnout compared to average of General Elections 2016 through 2022


The city decreased 12.7% in percent voter turnout compared to the average of General elections 2016-2022. The 2nd Ward showed a 10.3% decrease.
In terms of raw voter turnout, the city showed a 27.1% decrease compared to a 10.5% decrease by the 2nd Ward over this period. (The city saw a 8.2% raw turnout increase over the 2019 General while the 2nd Ward increased 20%.)
One thing to keep in mind is that the 2020 General tended to skew voter turnout due to record voter participation.
Turnout Voting Method

This shows the raw number of votes cast per Division broken into Mail, At Polls, Absentee, and Provisional.
Turnout Voting Method comparison to last General

It looks like voting by mail is stabilizing.
% voted early

- Mail-in voting, Civilian overseas, Absentee
- Any voting method other than At Polls (AP)
% Mail-in Ballots spoiled

Spoiling a mail-in ballot means bringing it to the polls and voting in person, possibly even provisionally. But, despite the name, spoiled ballots are not a bad thing, per se. It may mean that the voter forgot to mail their ballot on time, and since drop boxes have decreased in number, that person decided to bring their ballot to the polls. (We’d much rather have a spoiled ballot than no vote at all!) Overall, the number of spoiled ballots is pretty even in both the city and 2nd Ward.
Mail-in Ballots Unreturned


% Change in Turnout from last General

In general, turnout was down over the last General Election.
Judicial endorsements

All of the endorsed judicial candidates not only won the ward, but also won their elections. (The 2nd Ward only endorsed eleven of the thirteen Common Pleas slots.)
Mayoral endorsement

No surprises here.
Row office endorsements

All of our endorsed candidates won the ward and the city. We didn’t endorse for sheriff.
City Council endorsements

All of our endorsed candidates for District and At-Large Council won the ward and city.
Judicial Retention endorsements

Our endorsed recommendation to vote NO for Anne Marie Coyle won the ward. However, she won retention. Our other endorsed NO recommendation for Paula Patrick lost the ward. She also won retention.
Ballot Question endorsements

Our endorsed position on the one ballot question won the ward and city.
Now check out how the Ward performed City-wide if you haven’t already.

Related Posts