The numbers are in!
Have you ever wondered how your division performed in Philadelphia’s 2nd Ward when compared to other divisions? (What’s my division?) Well, the official voter file is in and we’ve crunched the numbers. (Don’t forget to check out how the ward performed city-wide if you haven’t already.)
Important notes:
- All statistics have been rounded up or down. So, some numbers may appear to be a statistical dead heat.
- All charts reflect registered Democrats.
So, let’s dive in…
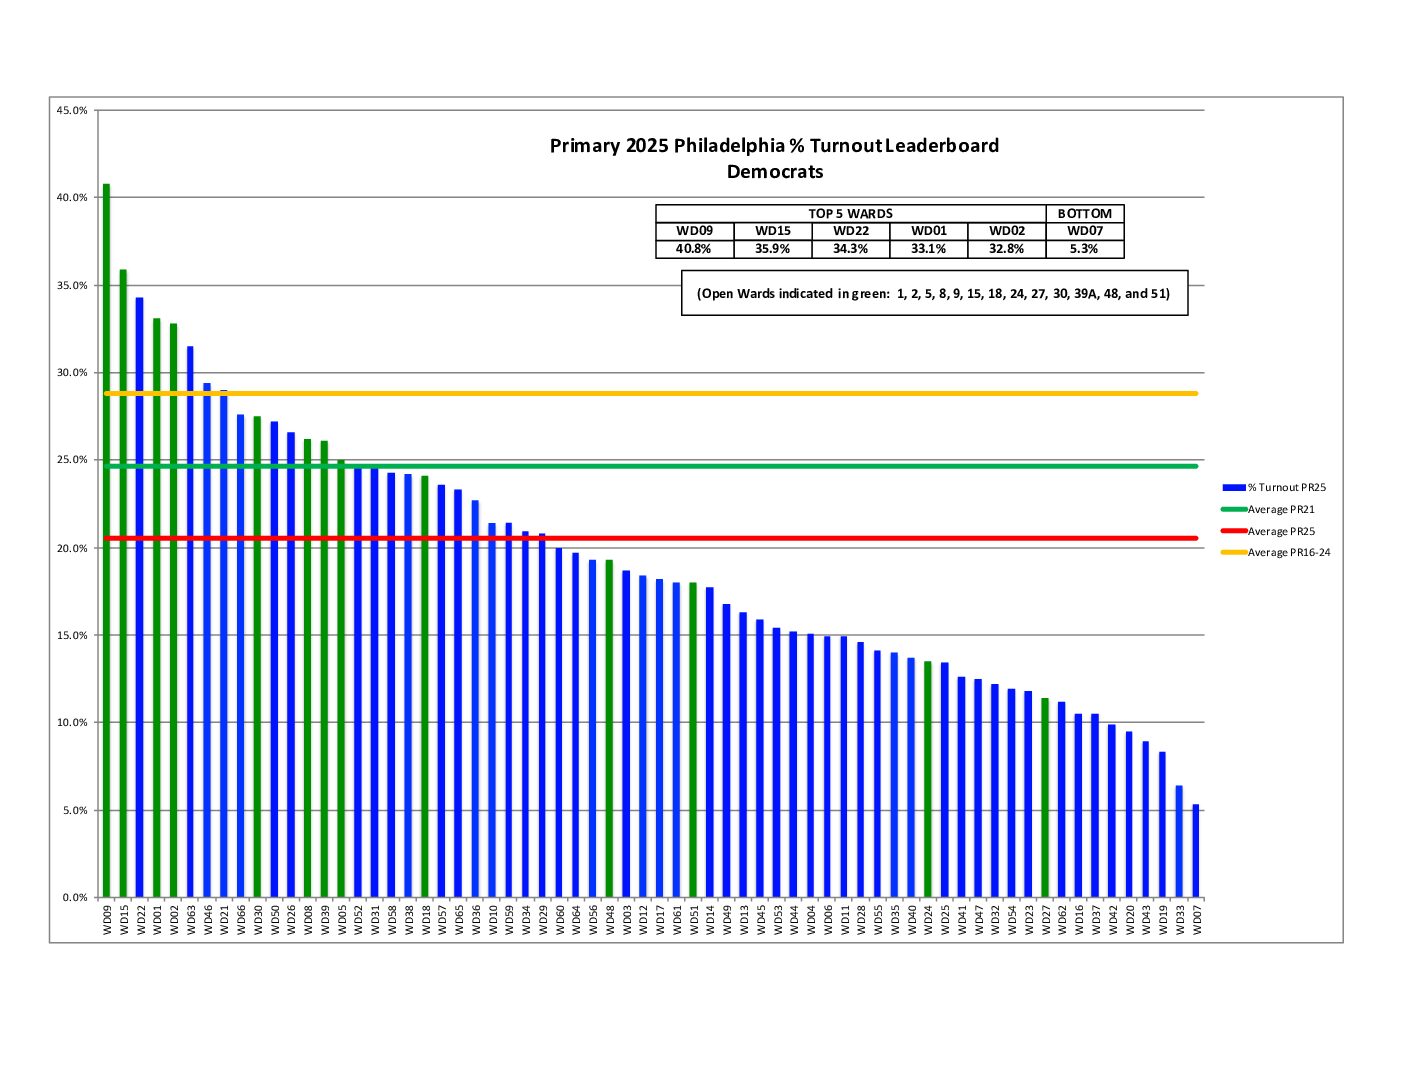
% Turnout

Almost every division beat the city average!

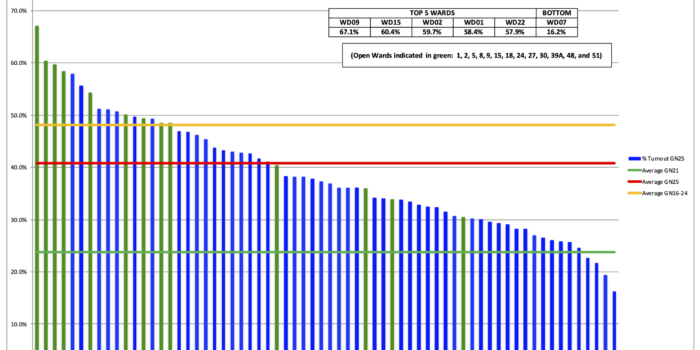
% and Raw Turnout compared to average of Primaries 2016 through 2022


The city increased 3.4% in percent voter turnout compared to the average of Primaries 2016-2022. The 2nd Ward showed an 8.4% increase.
In terms of raw voter turnout, the city showed a 14.5% increase compared to a 32.2% increase by the 2nd Ward over this period. (The city saw a 23% raw turnout increase over the 2019 Primary while the 2nd Ward increased 47.5%.)
Turnout Voting Method

This shows the raw number of votes cast per Division broken into Mail, At Polls, Absentee, and Provisional.
Turnout Voting Method comparison to last Primary

It looks like voting by mail has become less popular as pandemic concerns are easing.
% voted early

- Mail-in voting, Civilian overseas, Absentee
- Any voting method other than At Polls (AP)
% Mail-in Ballots spoiled

Spoiling a mail-in ballot means bringing it to the polls and voting in person, possibly even provisionally. But, despite the name, spoiled ballots are not a bad thing, per se. It may mean that the voter forgot to mail their ballot on time, and since drop boxes have decreased in number, that person decided to bring their ballot to the polls. (We’d much rather have a spoiled ballot than no vote at all!) Overall, the number of spoiled ballots is pretty even in both the city and 2nd Ward.
Mail-in Ballots Unreturned


% Change in Turnout from last Primary

In general, turnout was up over the last Primary Election.
Judicial endorsements

These charts show endorsed candidates who won the ward in blue, endorsed candidates who lost the ward in orange, and not-endorsed candidates who won the ward in green.
All of the endorsed judicial candidates not only won the ward, but also won their elections. The 2nd Ward only endorsed eight of the ten Common Pleas slots, and endorsed Caroline Turner for Municipal, who dropped out of that race. (She won for Common Pleas.)
Mayoral endorsement

Rebecca Rhynhart won the ward while endorsed candidate Helen Gym lost. Cherelle Parker won the city.
Row office endorsements

- The endorsed candidates for Commissioner and Controller won the ward and the city.
- Endorsed Tracey Gordon for Register of Wills won the ward, but John Sabatina won the city.
- We didn’t endorse for Sheriff. Untermeyer won our ward while Bilal won the city.
City Council endorsements

All endorsed candidates for District and At-Large Council won the ward. However, Nina Ahmad and Jim Harrity beat out McIllmurray and Almiron Citywide.
Ballot Question endorsements

All of the endorsed positions on questions won the ward. However, Question 4 flipped to Yes citywide.
Now check out how the Ward performed City-wide if you haven’t already.

Related Posts