The numbers are in!
Have you ever wondered how the 2nd Ward performed in Philadelphia when compared to other Wards? How about your particular Division? Well, the official voter file is in and we’ve crunched the numbers.
Important notes:
- All statistics have been rounded up or down. So, some numbers may appear to be a statistical dead heat.
- All charts reflect registered Democrats.
So, let’s dive in…
% Turnout

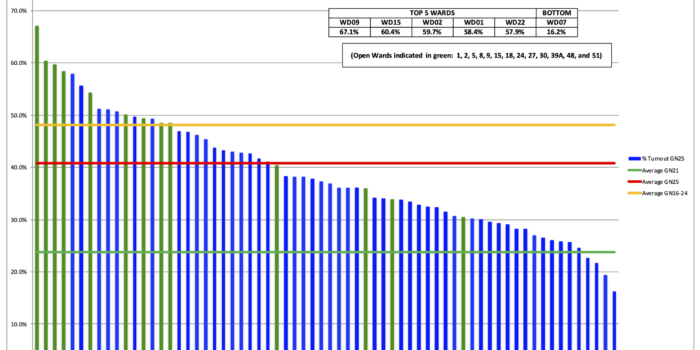
We beat the city percent turnout by about 18%. And compared to the last comparable Primary in 2019, our voter turnout increased by 11.1%, about 2.5x that of Philadelphia. Check out the Leaderboard below for where we finished city-wide.
% Turnout Leaderboard

We came in 4th in the City, only 2% away from the 15th Ward in 2nd place, which maintains our momentum. (Please note the Open Wards shown in green. What’s an Open Ward?)
2nd Ward and City Turnout History


The 2nd Ward had our highest Primary voter turnout – even beating 2016 and 2020! This helps maintain our effort to increase both raw votes and percent voter turnout. The city is showing a slight decline in both of these metrics.
% and Raw Turnout compared to average of Primaries 2017 through 2022


The city increased 3.4% in percent voter turnout compared to the average of Primaries 2016-2022. The 2nd Ward showed a 7.9% increase.
In terms of raw voter turnout, the city showed a 14.5% increase compared to a 31.8% increase by the 2nd Ward over this period. (The city saw a 23.3% raw turnout increase over the 2019 Primary while the 2nd Ward increased 47.5%.)
Turnout Voting Method

This shows the raw number of votes cast per Ward broken into Mail, At Polls, Absentee, and Provisional. The 2nd Ward essentially matched the city in terms of voting method.
Turnout Voting Method comparison to last Primary

It looks like voting by mail is becoming less popular as the pandemic wanes.
% voted early

- Mail-in voting, Civilian overseas, Absentee
- Any voting method other than At Polls (AP)
% Mail-in Ballots spoiled

% Mail-in Ballots Unreturned

% Change in Turnout from last Primary

If we look at % Change in Turnout between the Primary Elections of 2022 and 2023, voter turnout was up 23% with the 2nd Ward at 21%.
Now, check out how the different Divisions stacked up within the 2nd Ward.
Related Posts