The numbers are in!
Quick Links
Have you ever wondered how the 2nd Ward performed in Philadelphia when compared to other wards? How about your particular division? Well, you’ve come to the right place. The official voter file is in and we’ve crunched the numbers.
Important notes:
- All statistics have been rounded up or down. So, some numbers may appear to be a statistical dead heat.
- All charts reflect registered Democrats.
- The image sliders below show Philadelphia on the left and the 2nd Ward on the right.
So, let’s dive in…
% Turnout
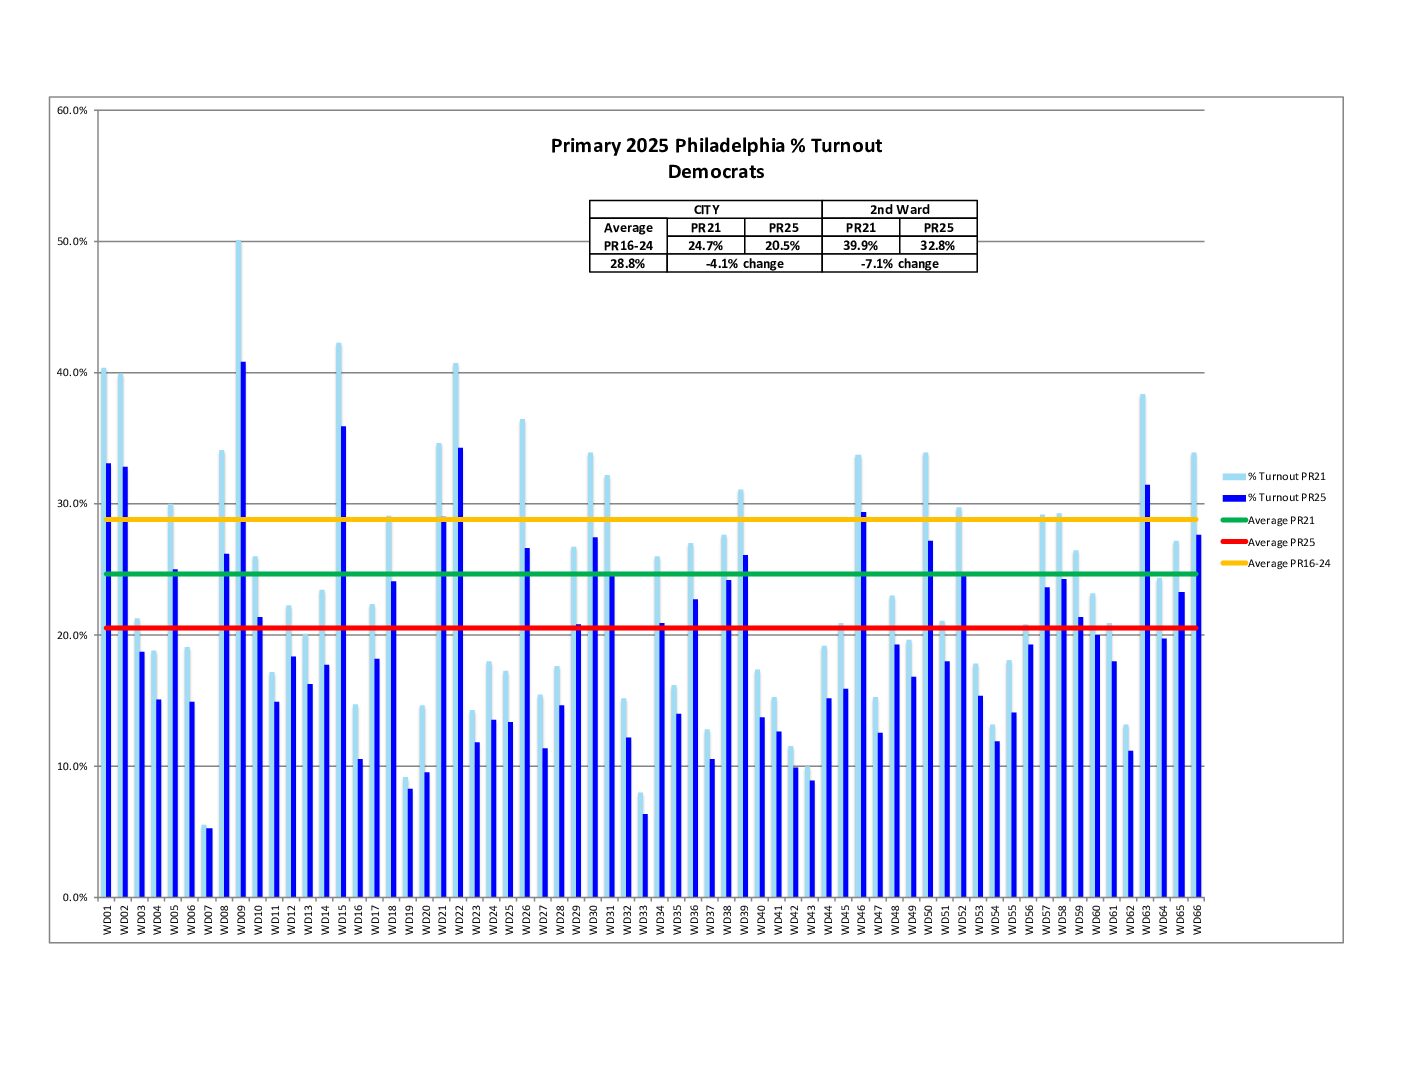
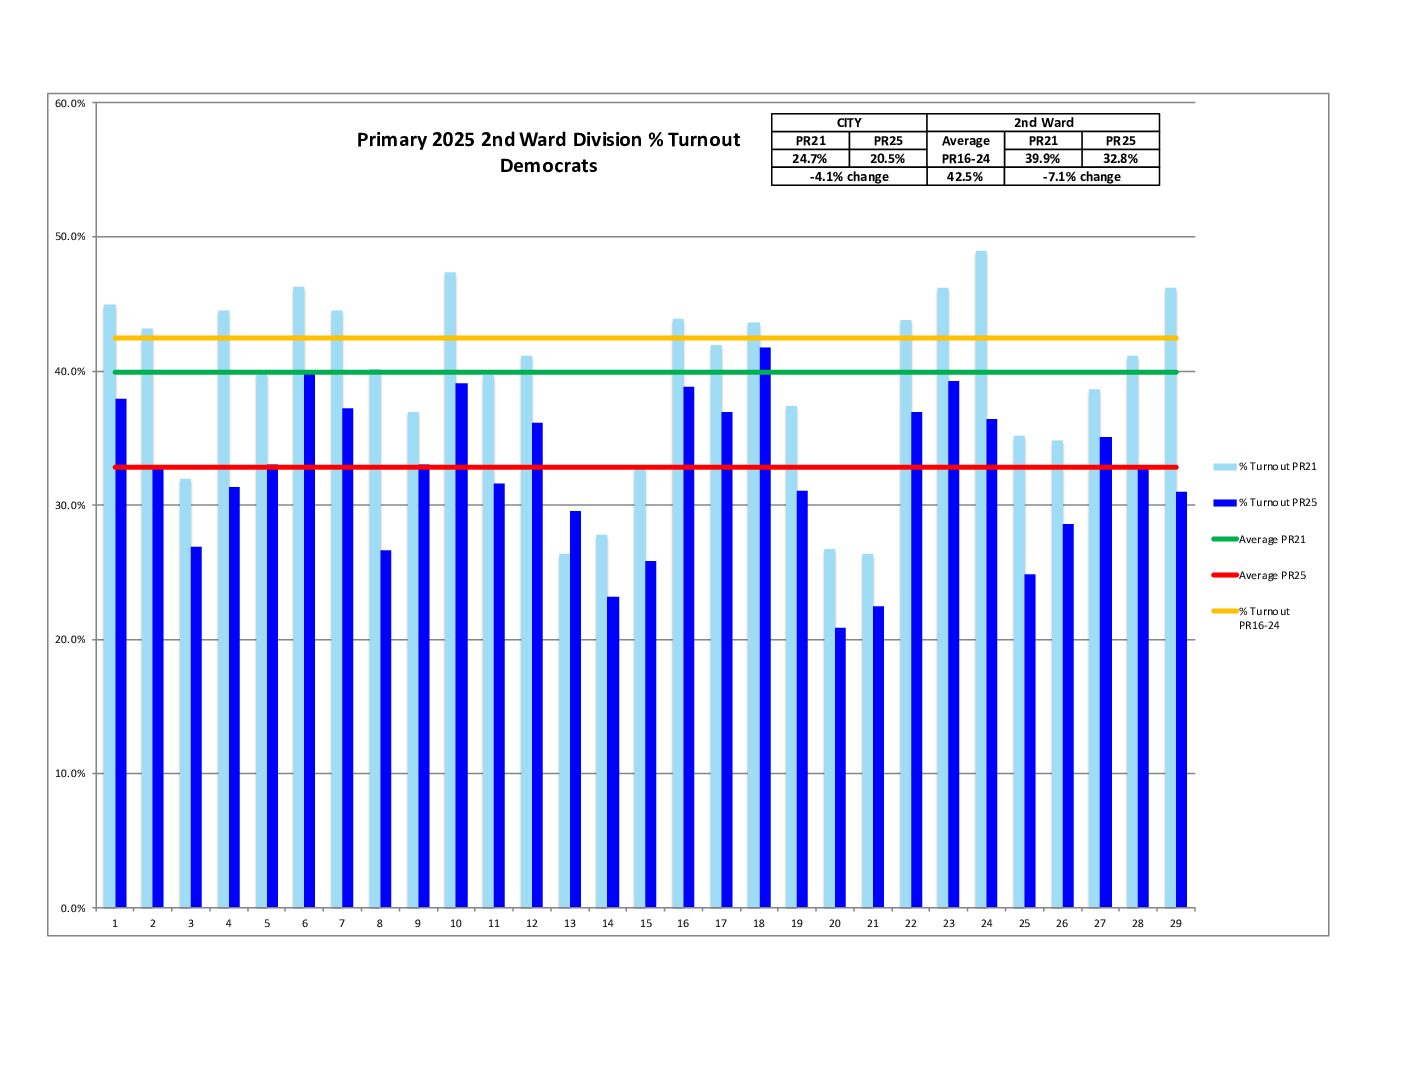
City turnout of 20.5% shows a 4.1% decrease over the comparable 2021 Primary Election. 2nd Ward turnout was 32.8%, beating the city by 12.3%. Compared to the Primary of 2021, our voter turnout decreased by 7.1%, which is worse than what the city saw by 3%. Check out the leaderboard below for how we finished city-wide and also for how our divisions performed.
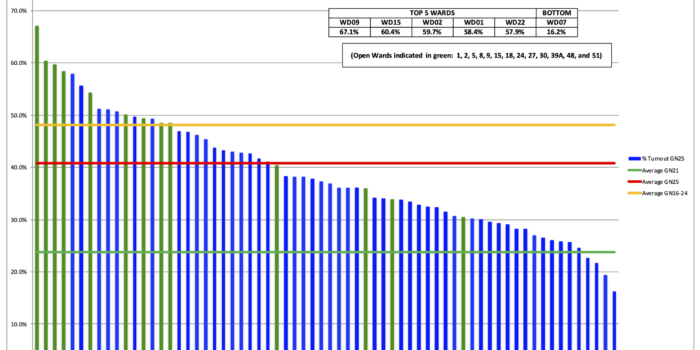
% Turnout Leaderboard
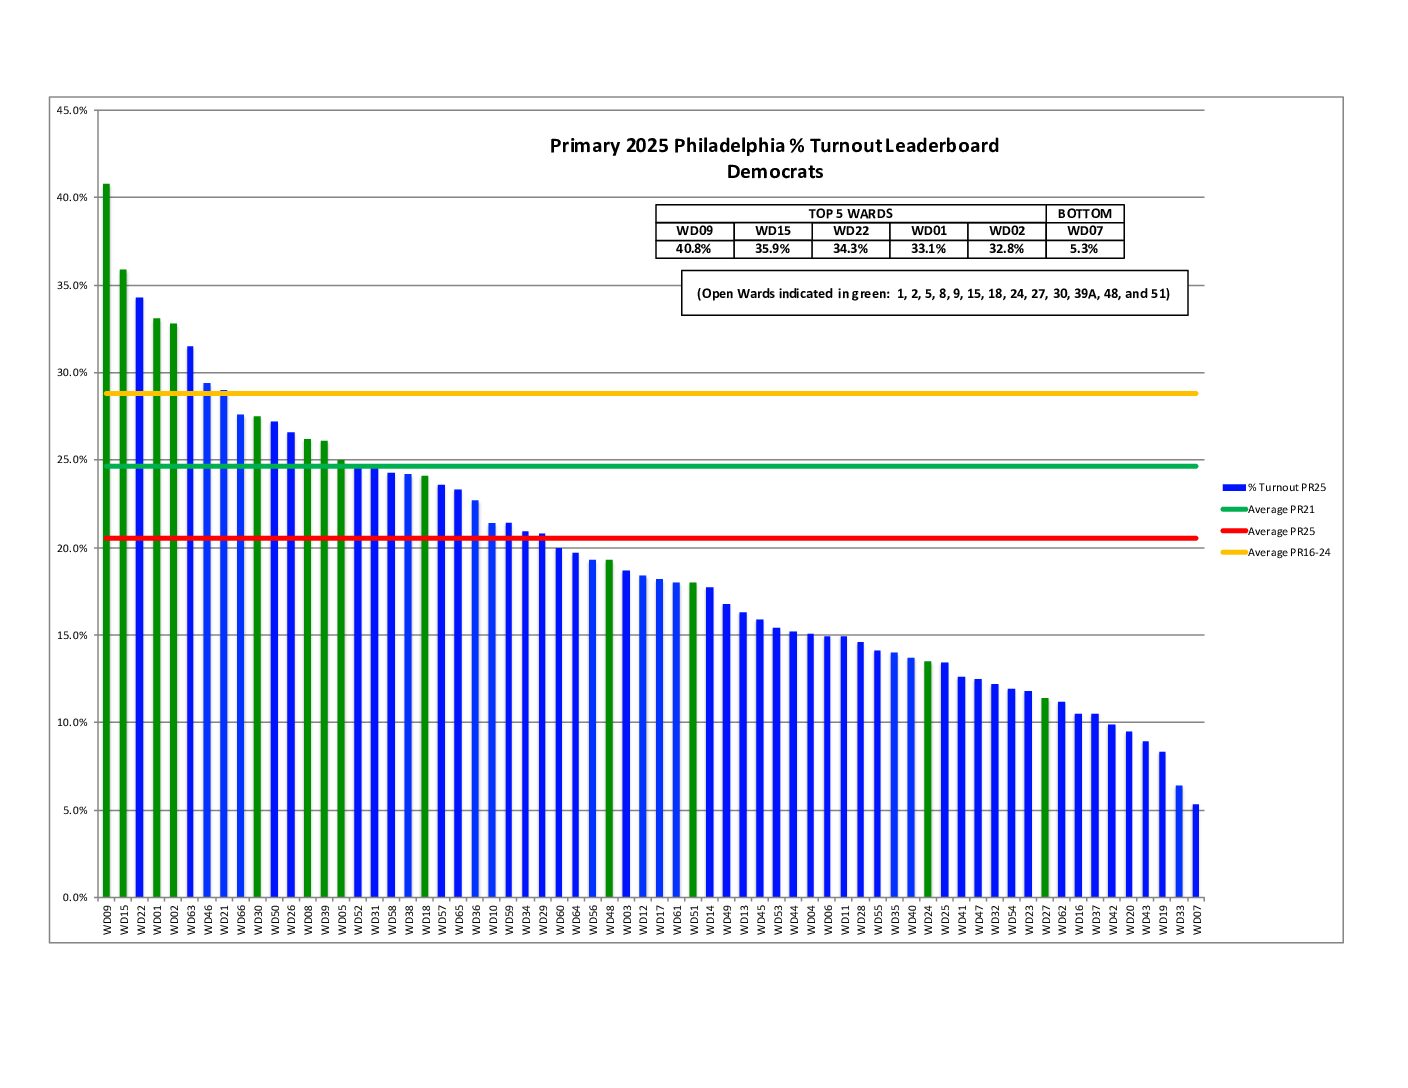
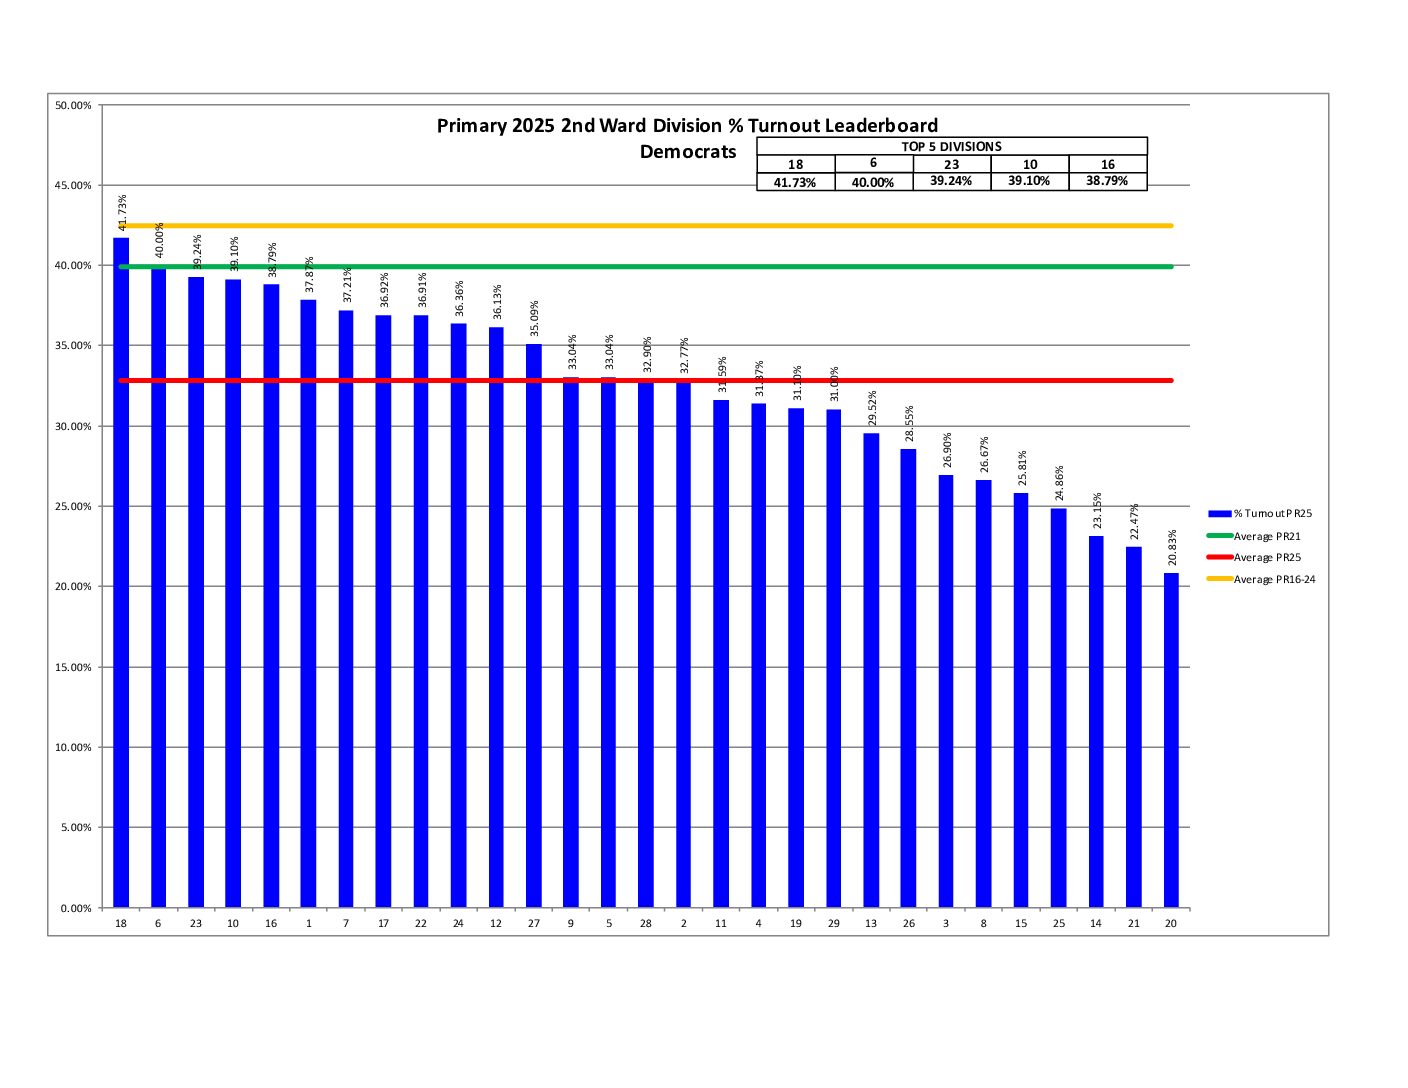
The 2nd Ward finished 5th in the city at 32.8%. That’s within .3 percentage points of 4th place, and 8% of 1st place, which is perennially the 9th Ward. You can see the city average in red at 20.5%. (Please note the Open Wards shown in green. What’s an Open Ward?)
For the top five spots in the 2nd Ward, Division 18 came in first, followed by 6, 23, 10, and 16. (What’s my division?)
Turnout Leaderboard
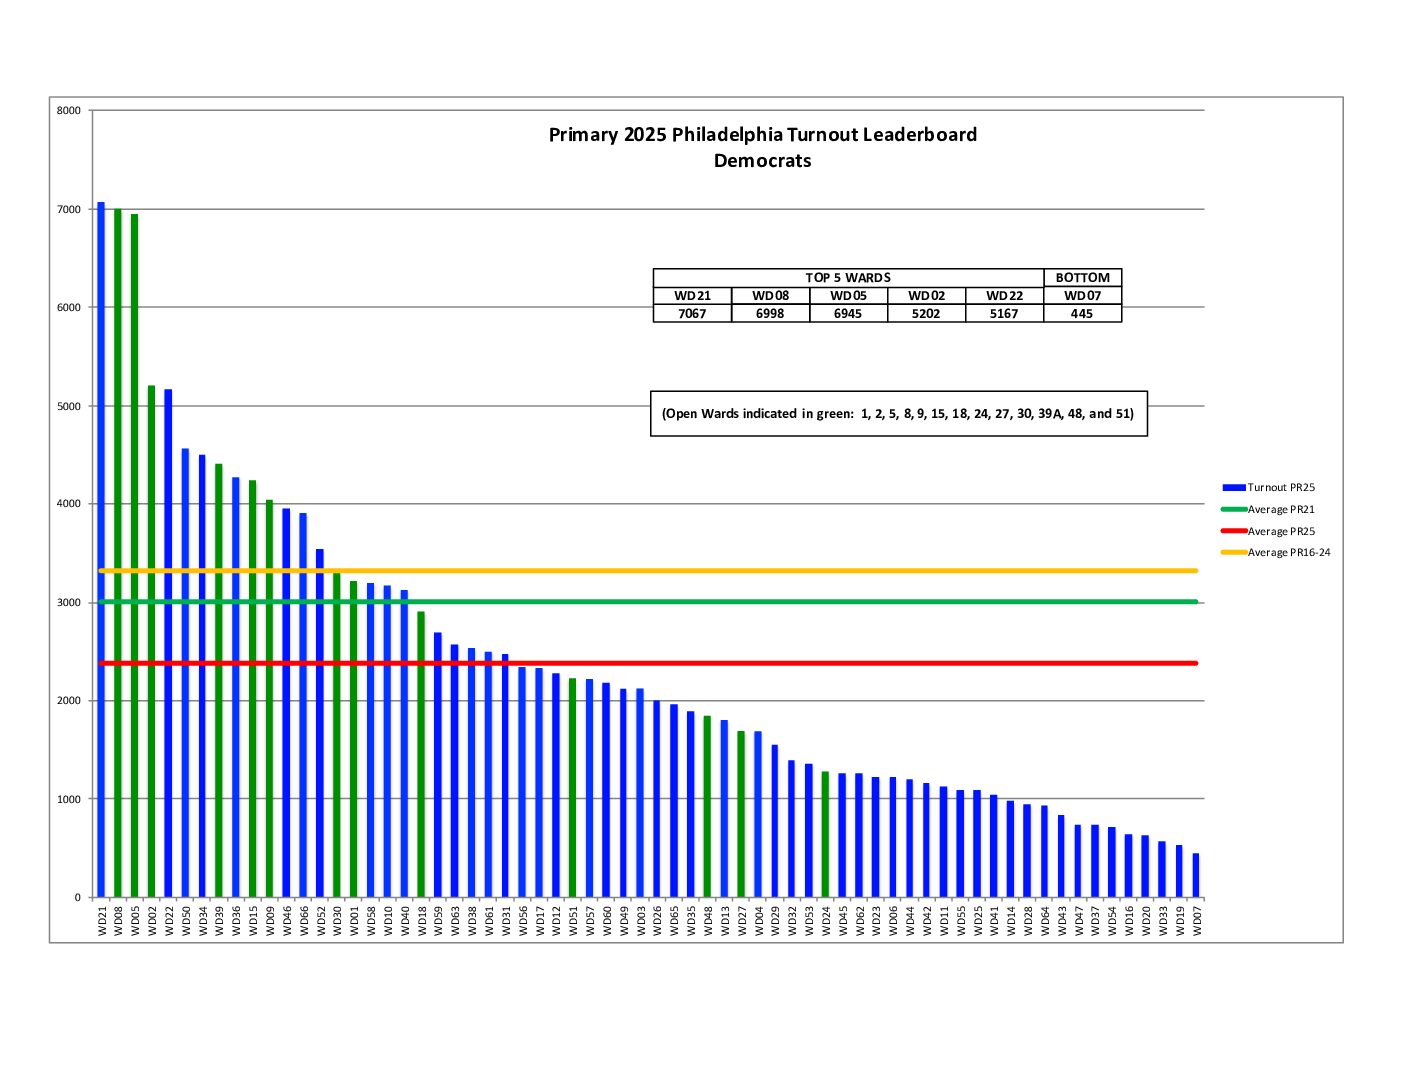
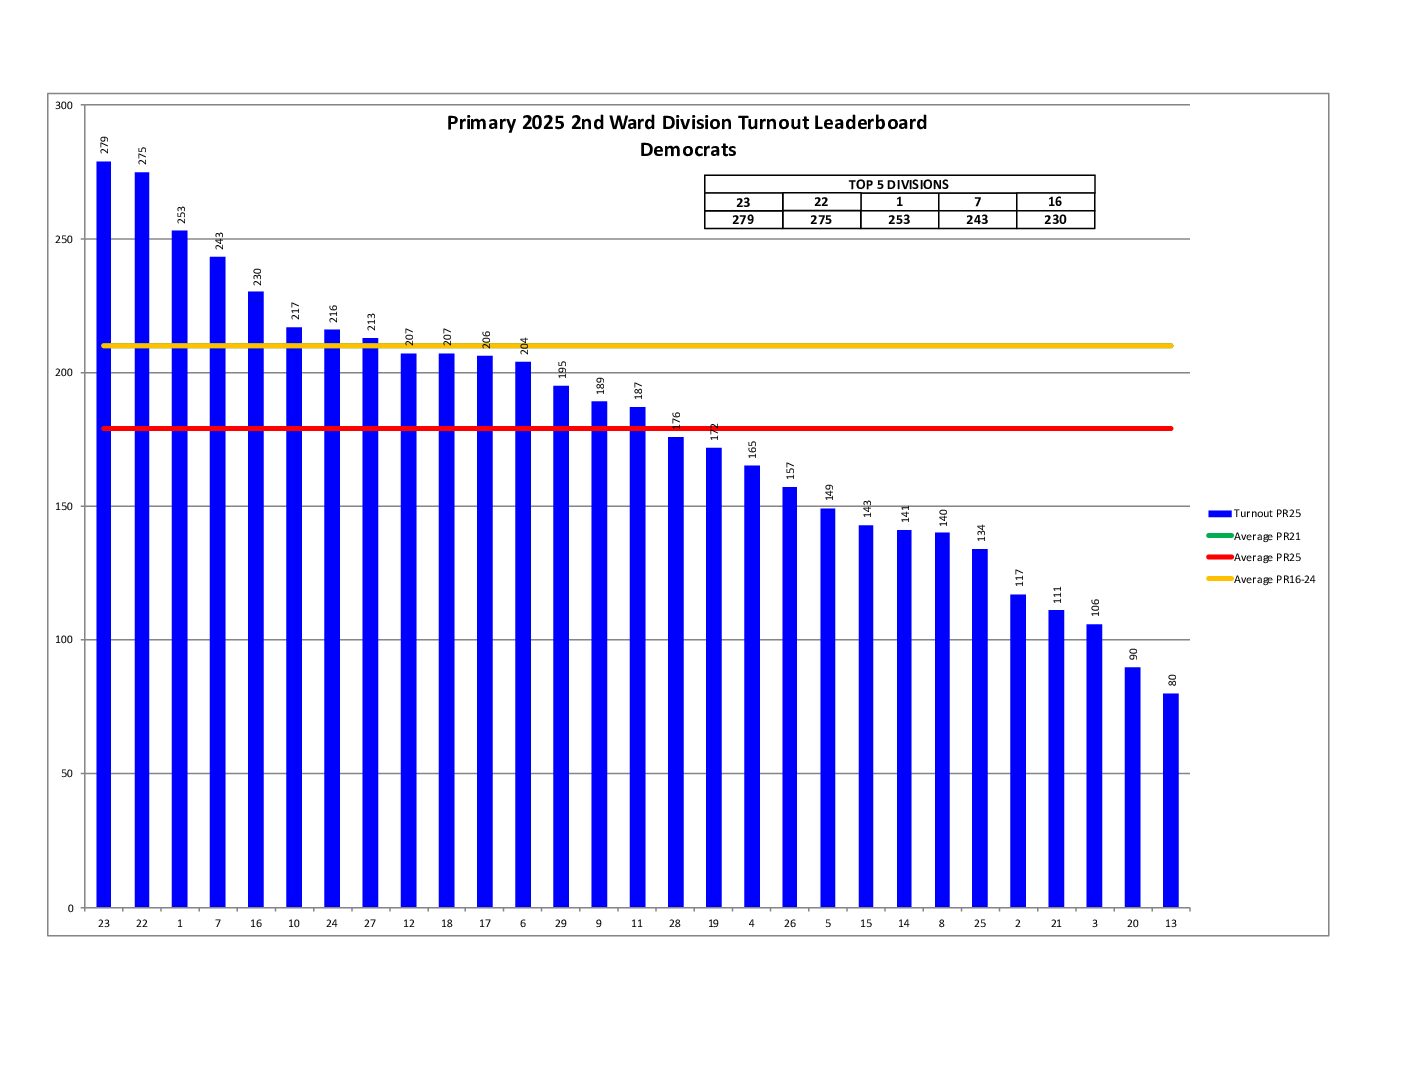
Ever wonder which ward or division has the most clout in terms of generating raw votes? The 2nd Ward was 4th in the city while Division 23 generates the most votes in our ward. (Please note the Open Wards shown in green. What’s an Open Ward?)
Turnout History
% Turnout
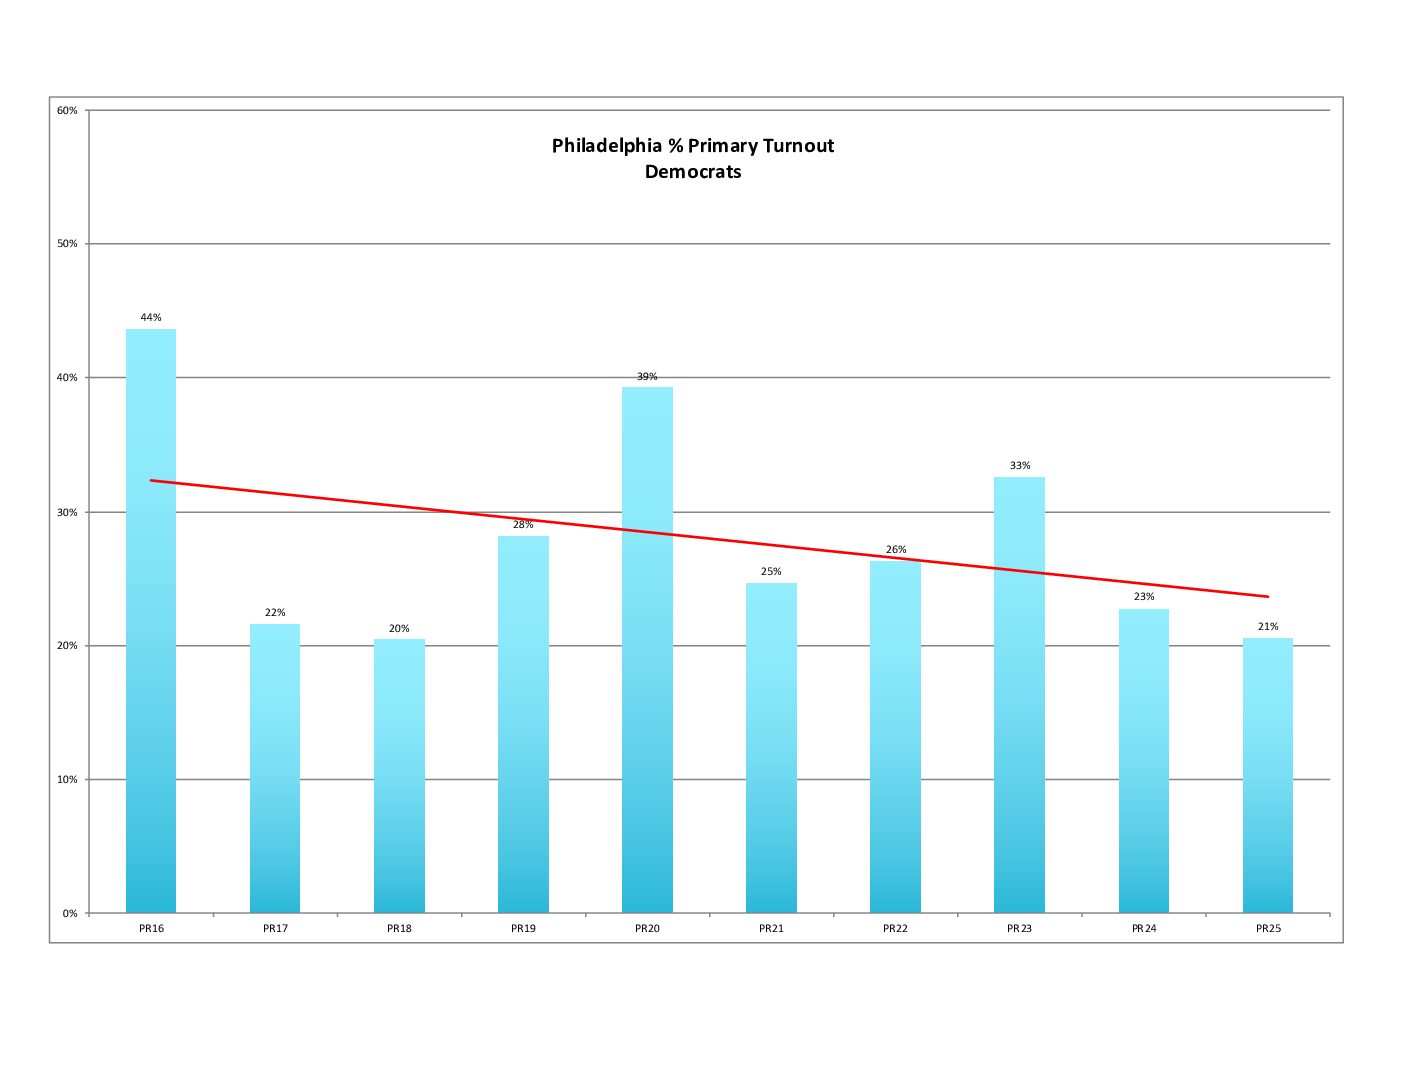
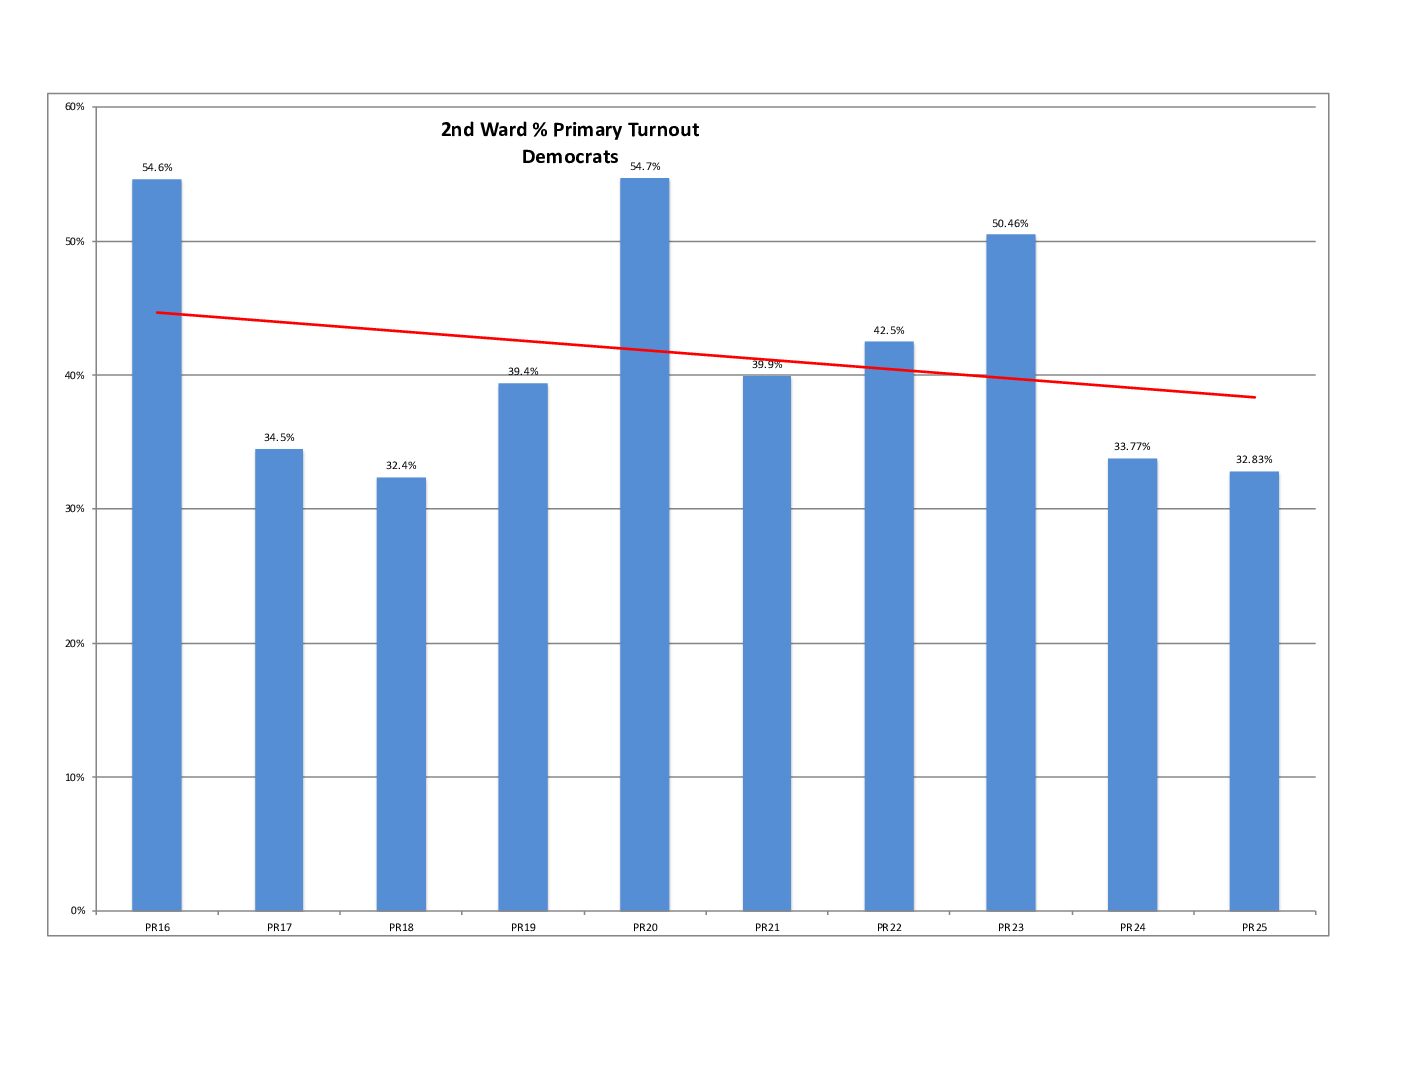
Unfortunately, both the 2nd Ward and city are in a downward trajectory for percent voter turnout in primaries.
Raw Turnout
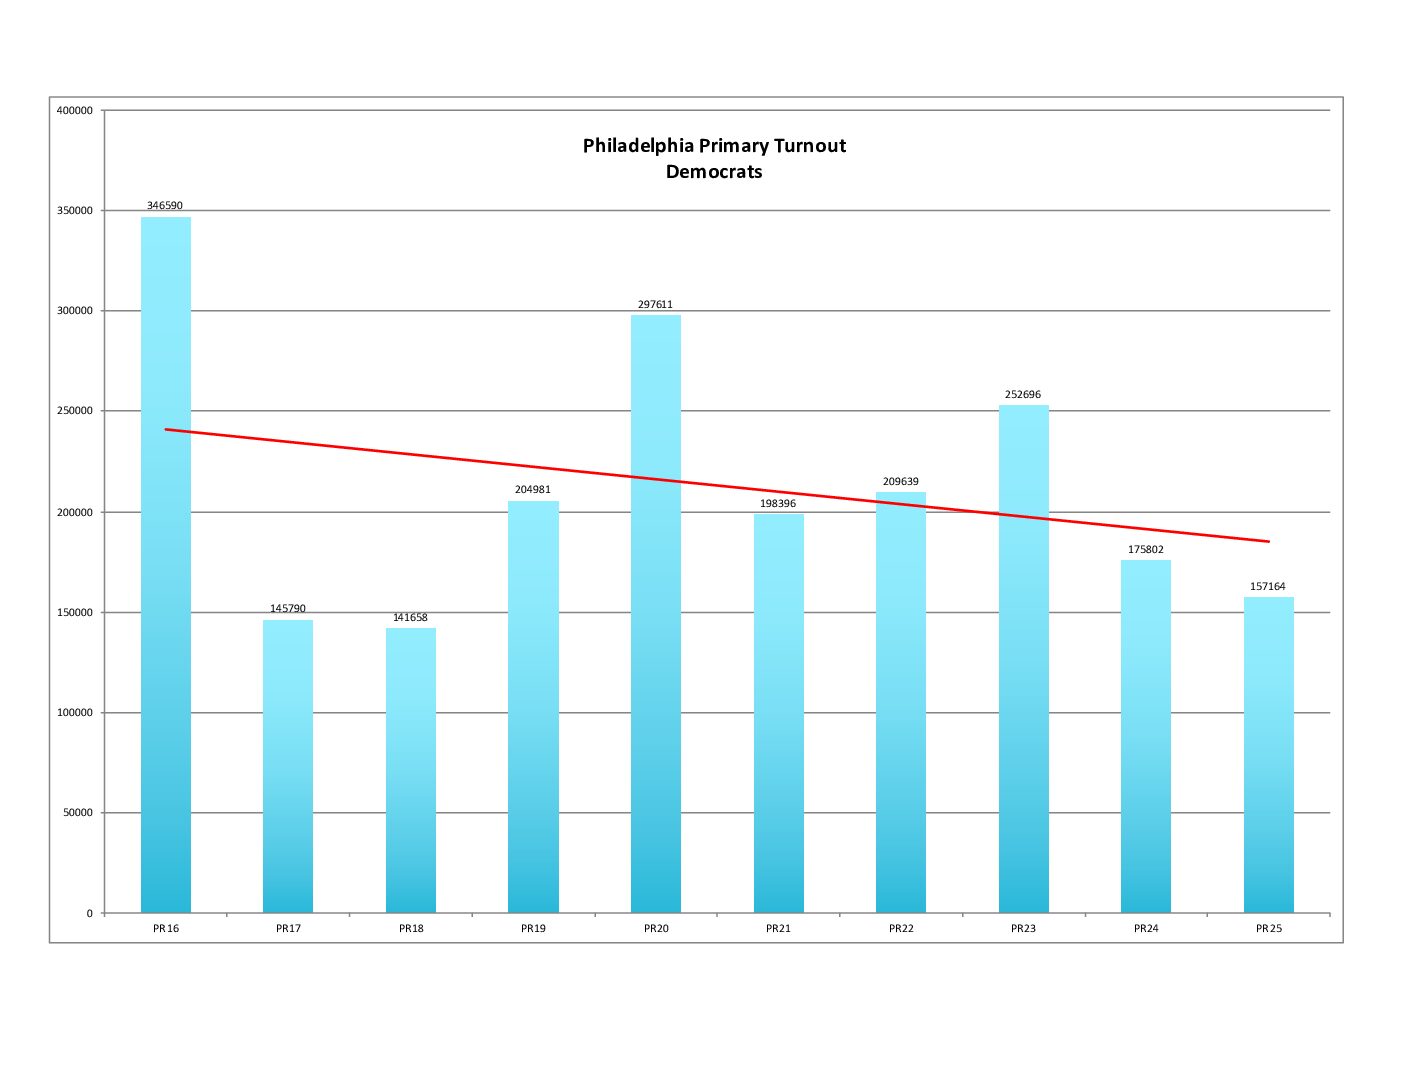
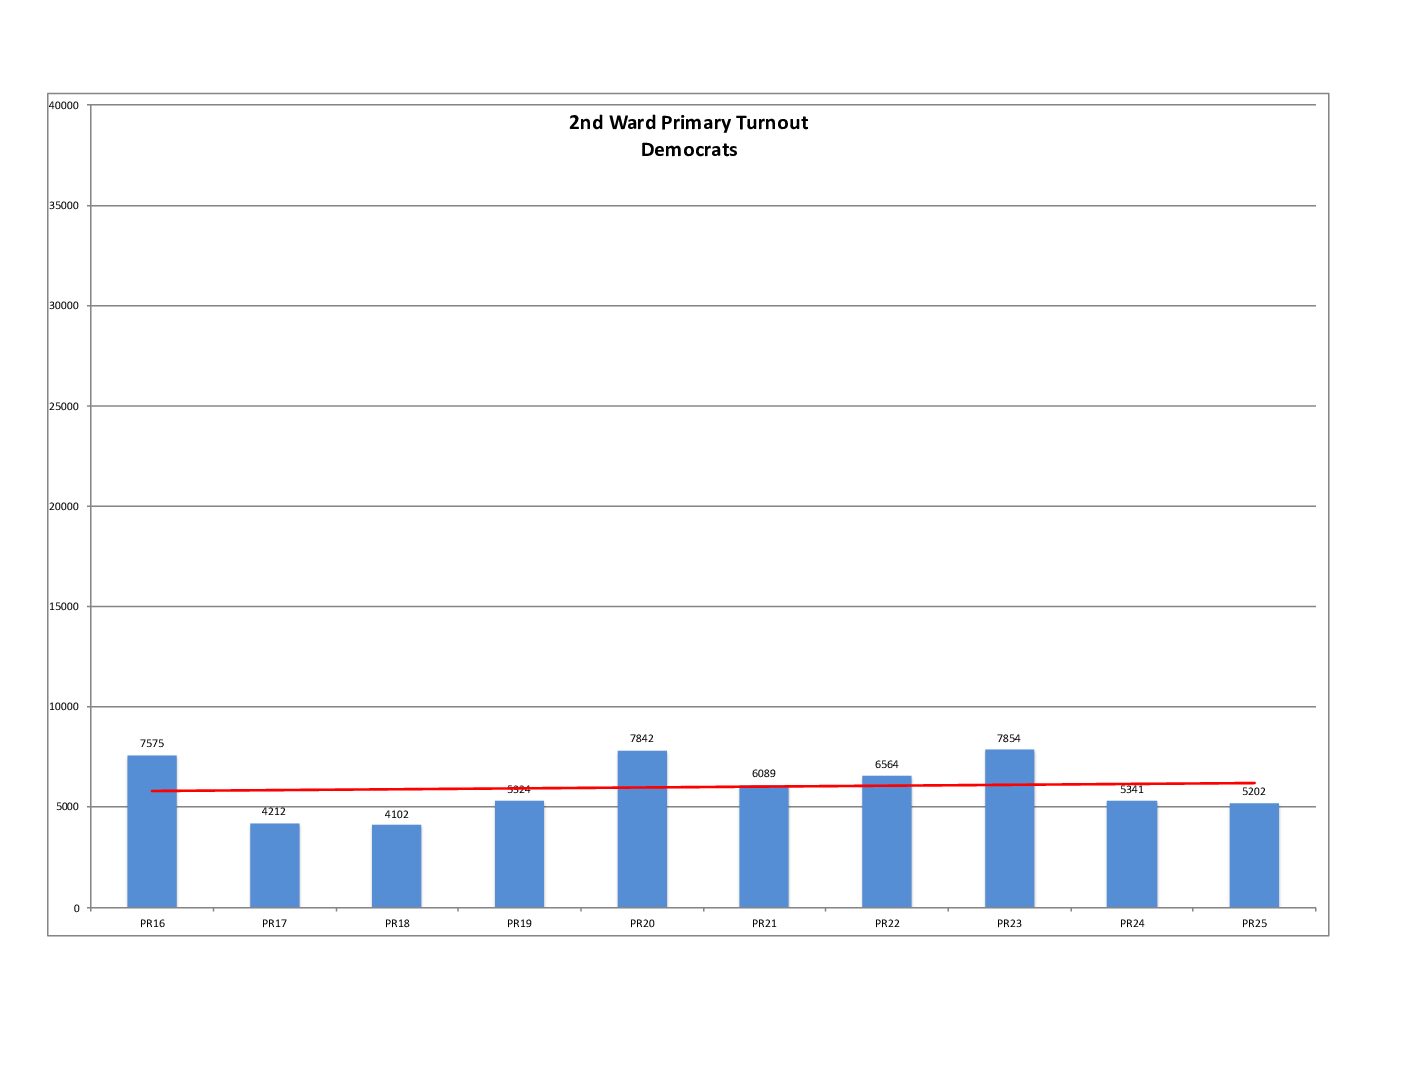
The 2nd Ward’s primary turnout is slightly better than flat, while the city is decidedly in a downward trajectory.
% and Raw Turnout Compared to Average of General Elections 2016 through 2023
% Turnout
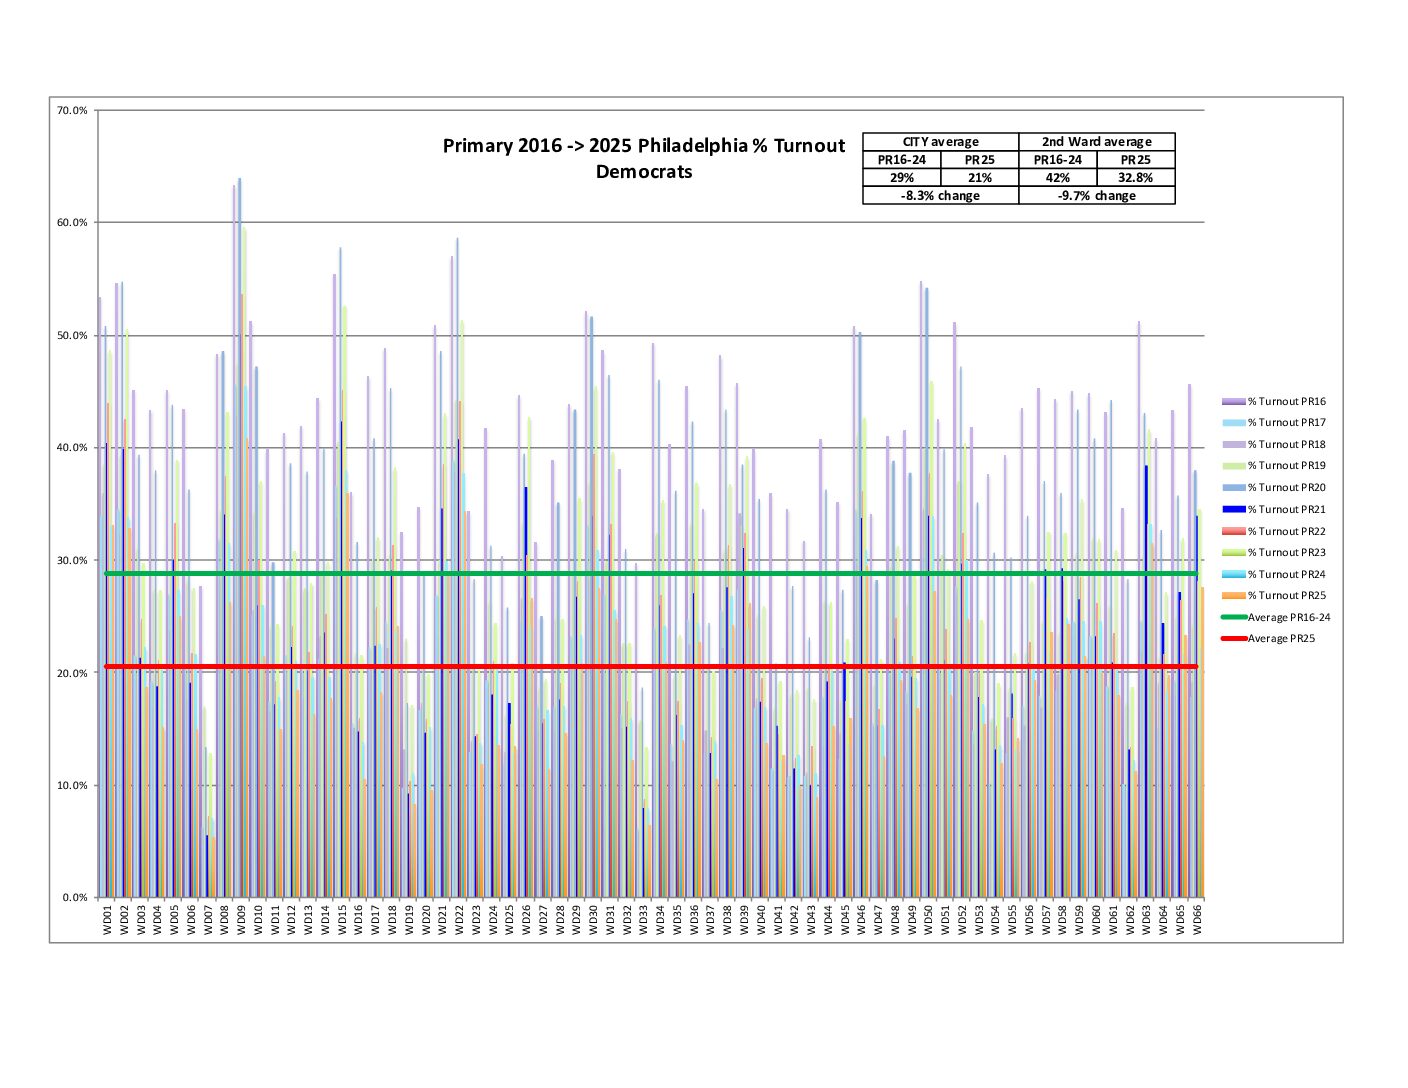
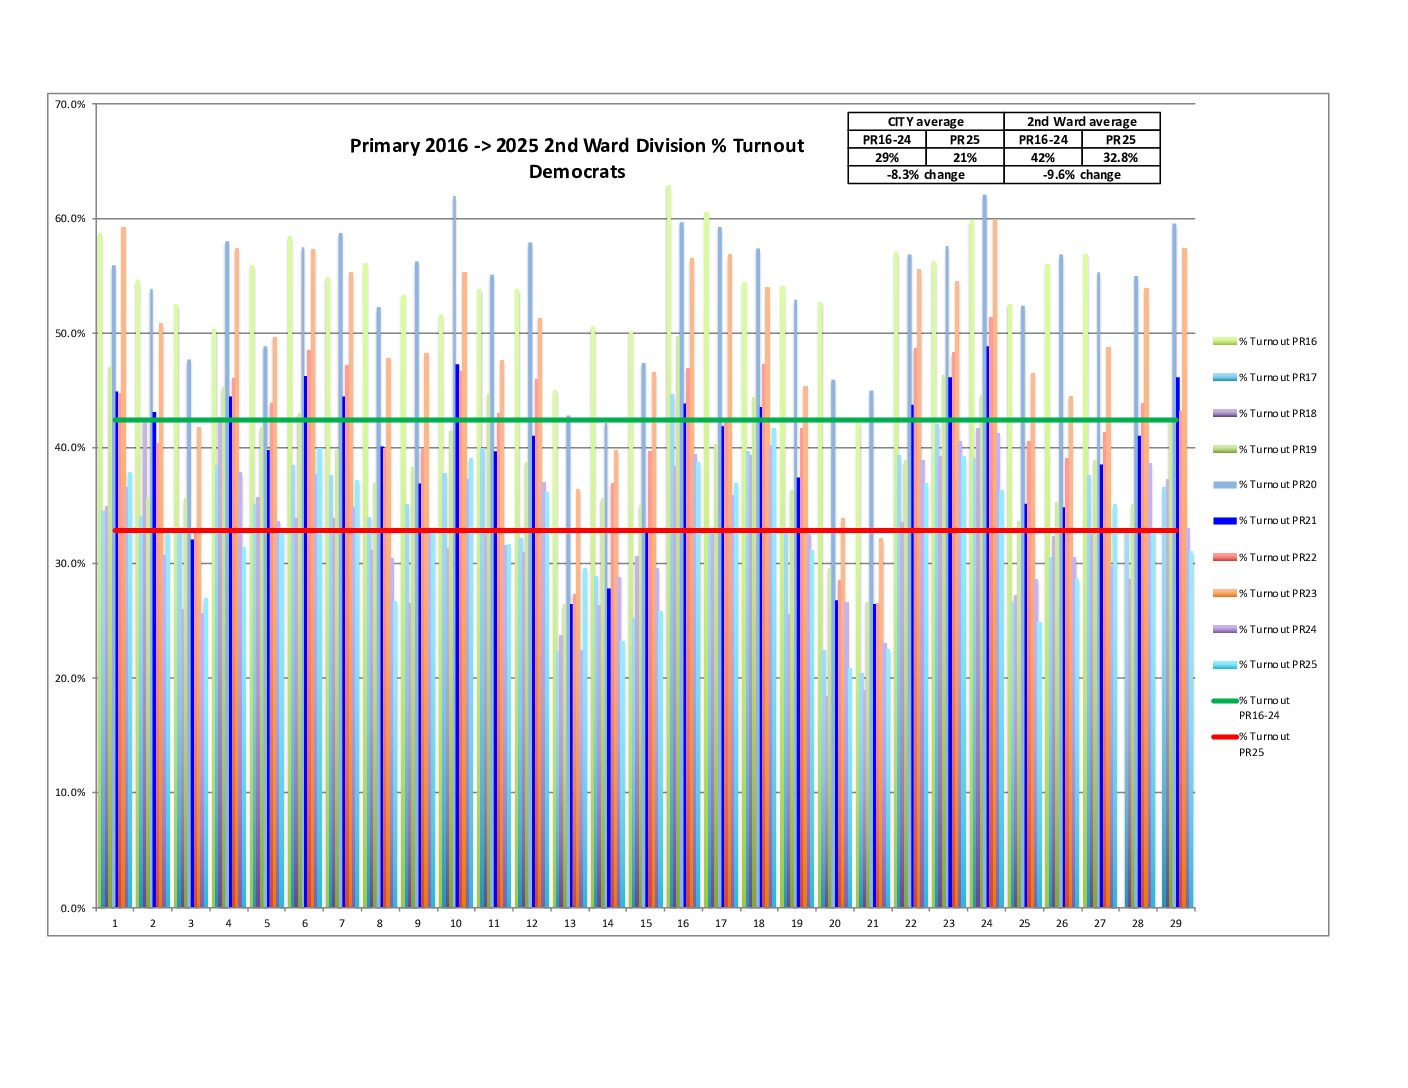
The city shows an 8.3% decrease while the 2nd Ward shows a 9.6% decrease compared to the average of 2016-2024 Primary Elections.
Raw Turnout
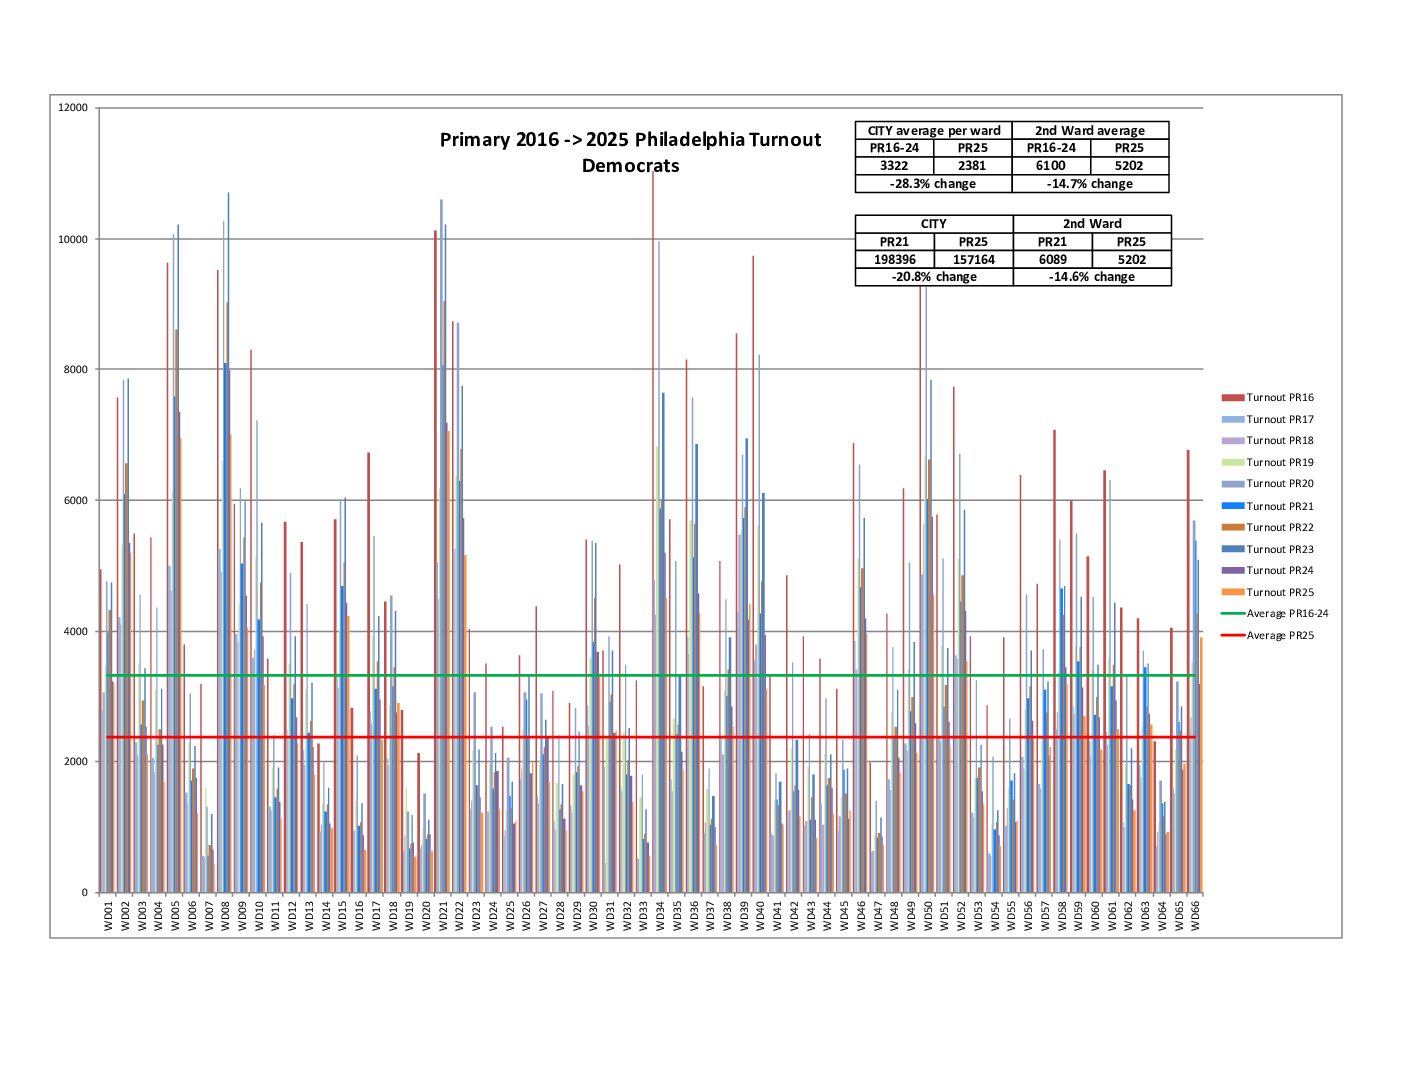
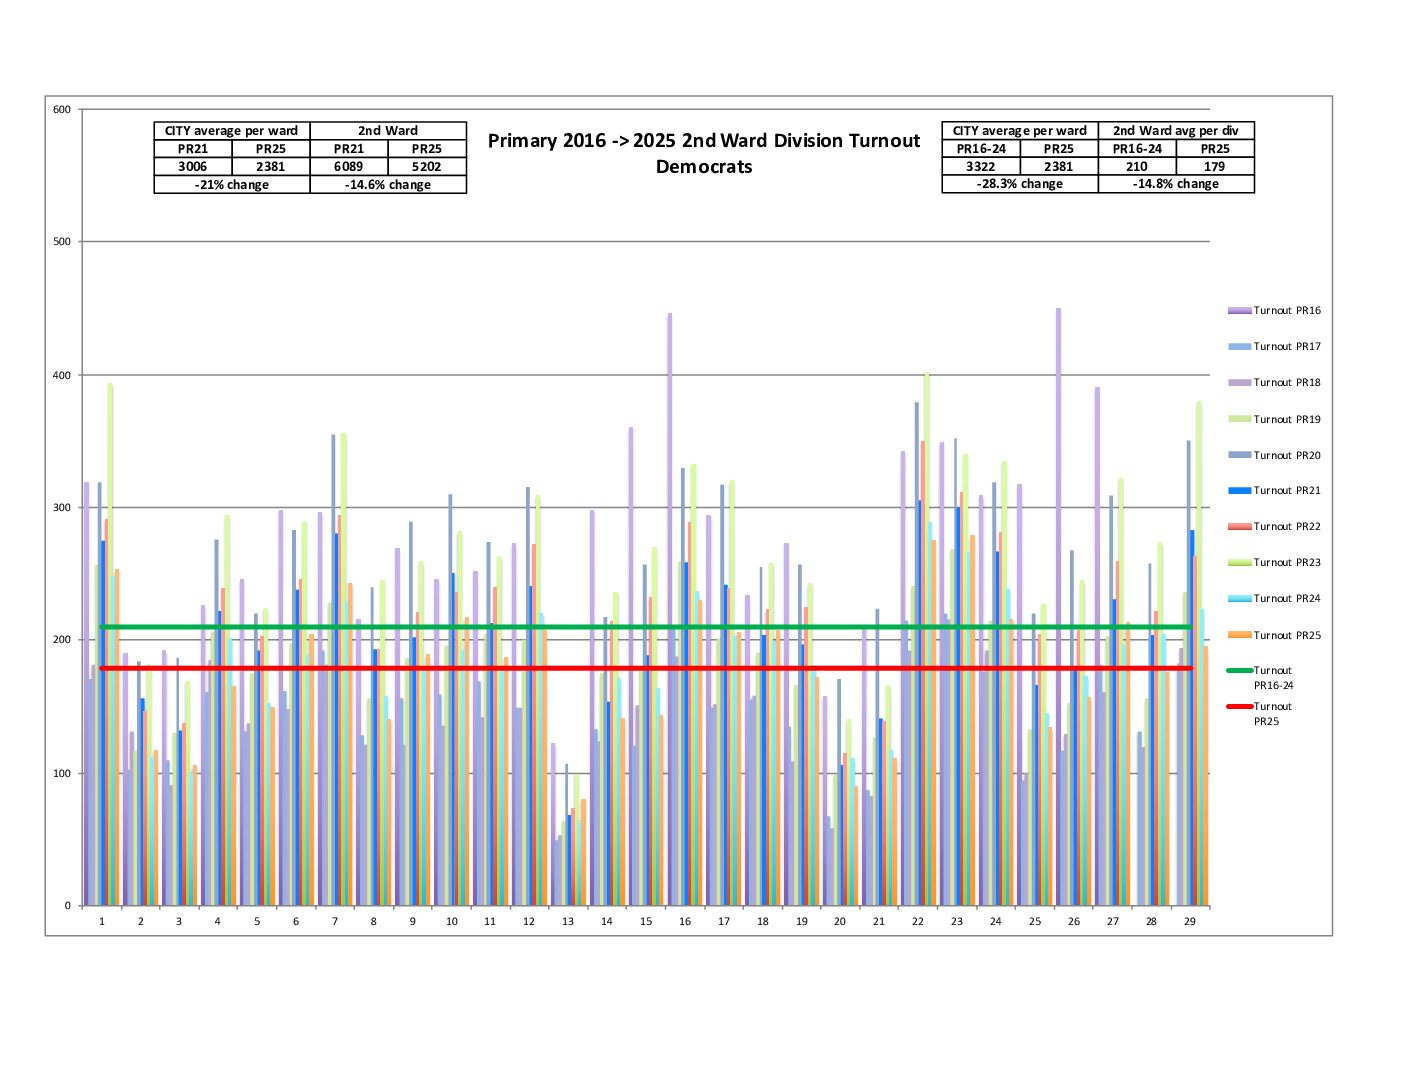
When comparing the appropriate 2025 Primary turnout to all of these stats…
- City average turnout per ward for 2016-2024 Primaries
- 2nd Ward average turnout per division for 2016-2024 Primaries
- City or 2nd Ward turnout for comparable 2021 Primary
- City average per ward for comparable 2021 Primary
- 2nd Ward average per division for comparable 2021 Primary
…there are double digit decreases in vote turnout.
Turnout by Voting Method
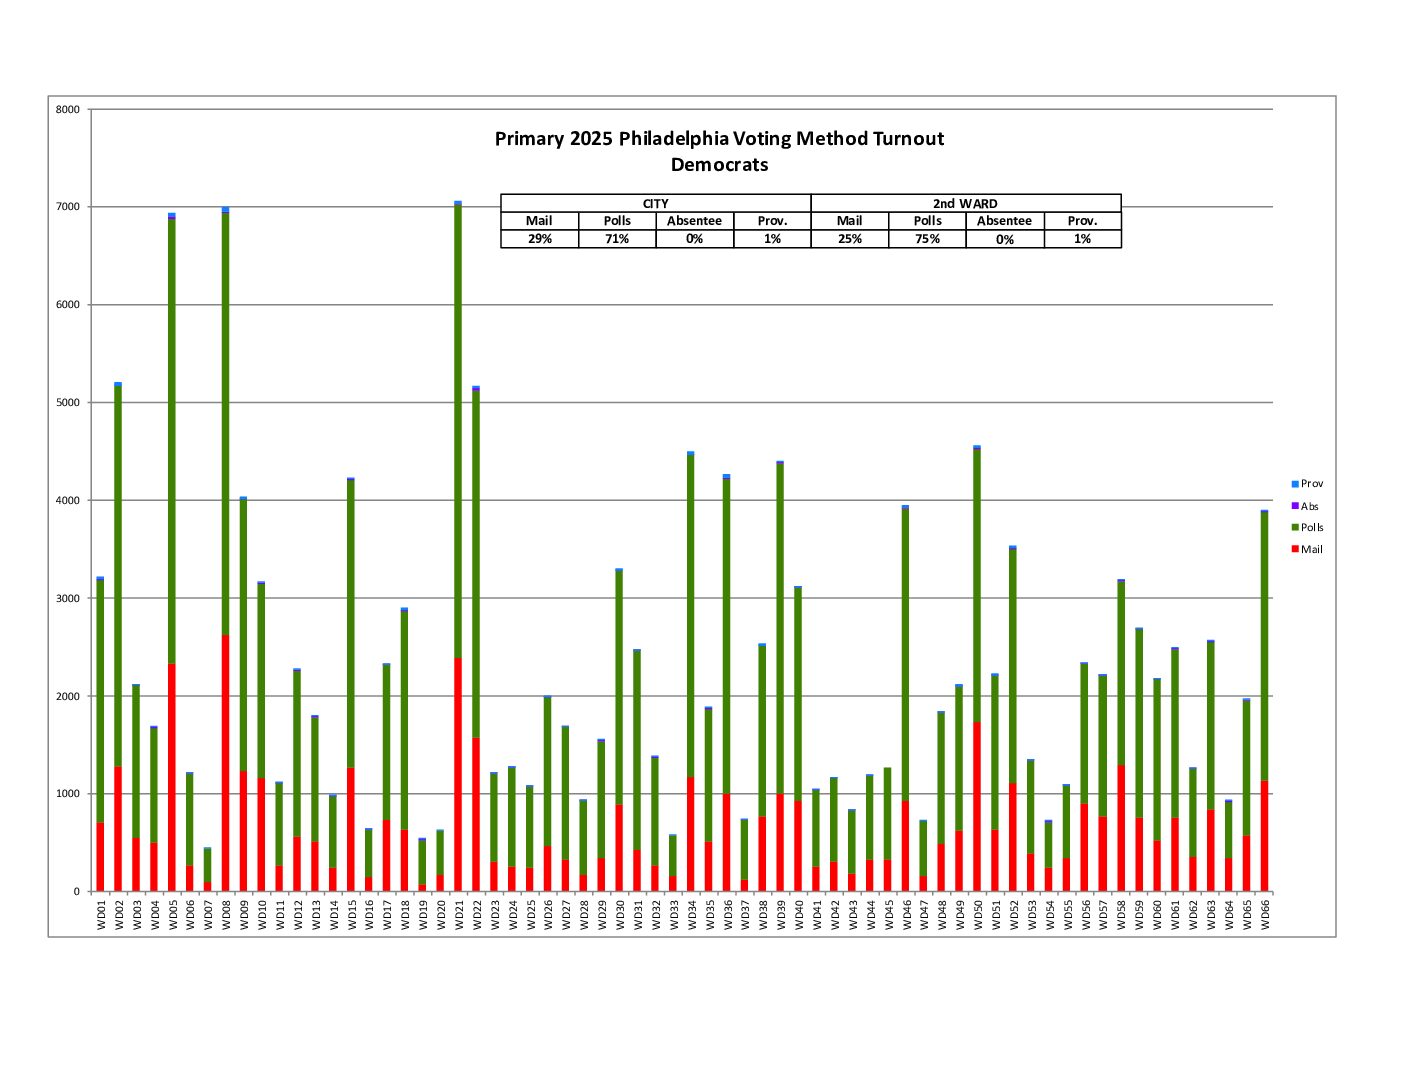
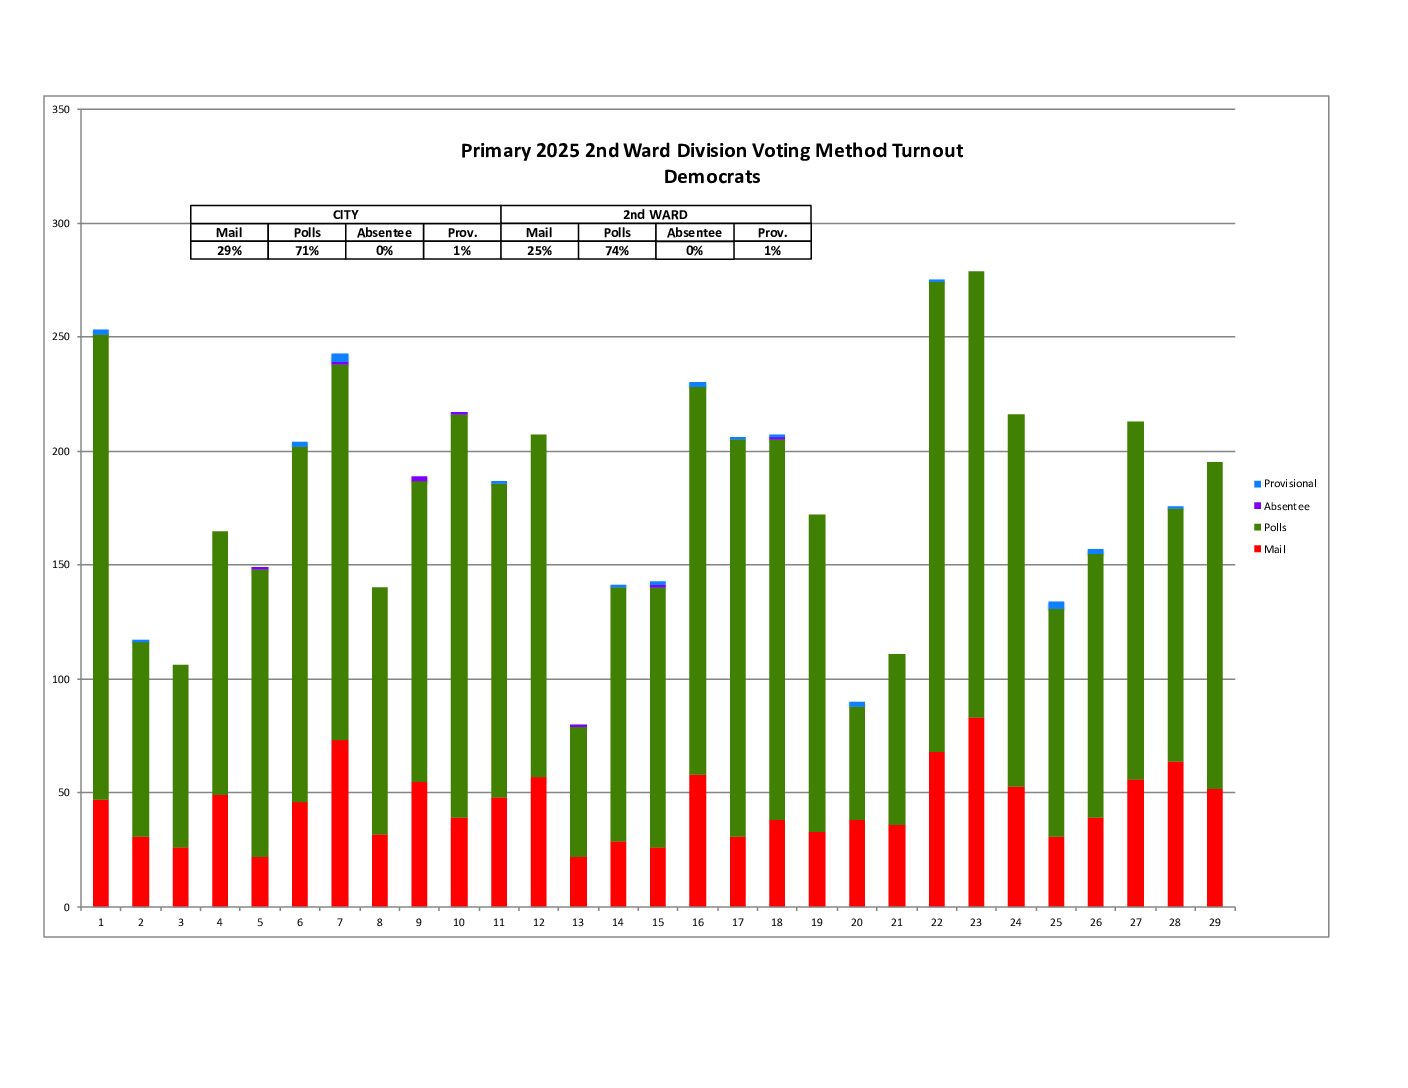
This shows the raw number of votes cast per ward and division broken into Mail, At Polls, Absentee, and Provisional. The 2nd Ward showed a 4% decrease in mail voting compared to the city.
Turnout by Voting Method Comparison to Last General
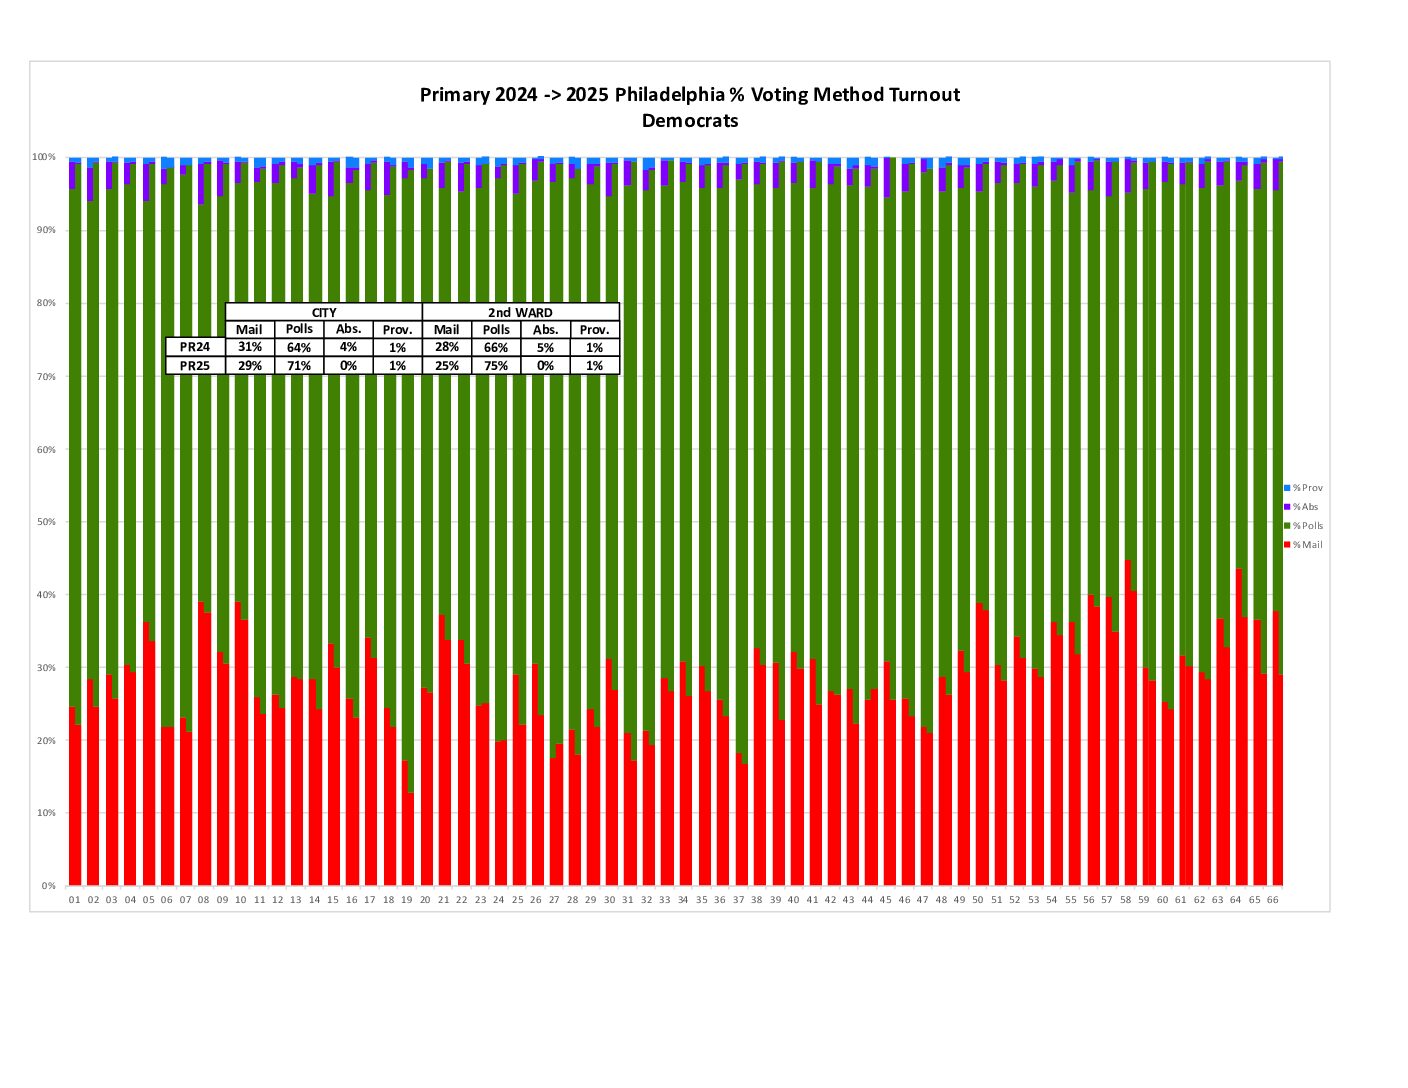
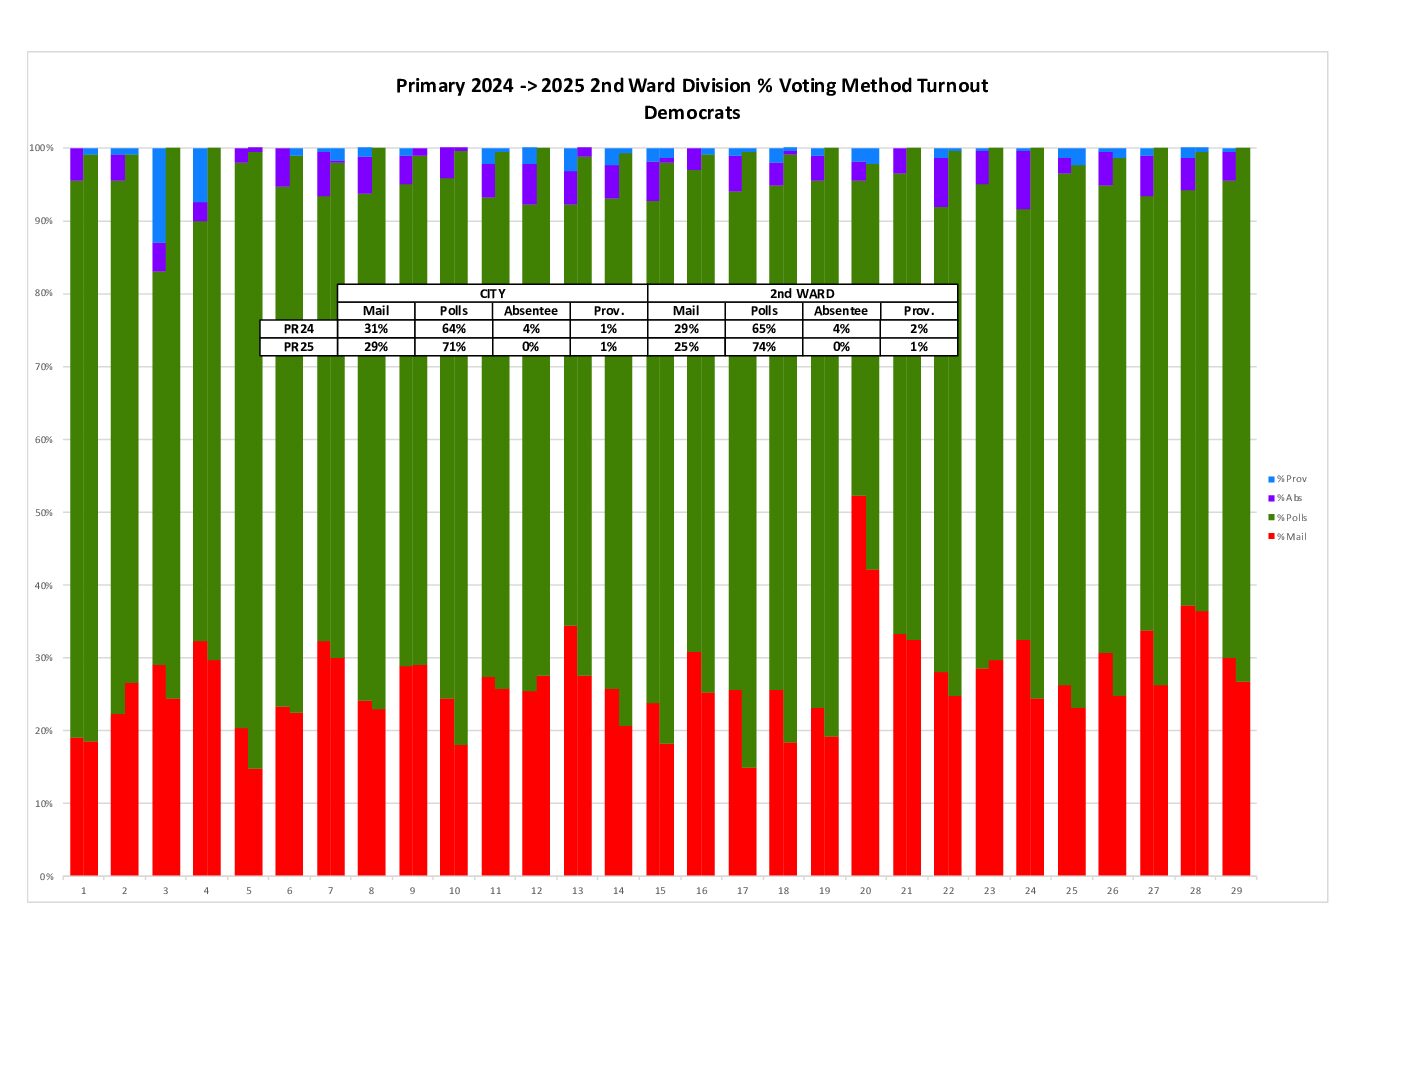
It looks like voting by mail was less popular over the last primary election.
% Voted Early
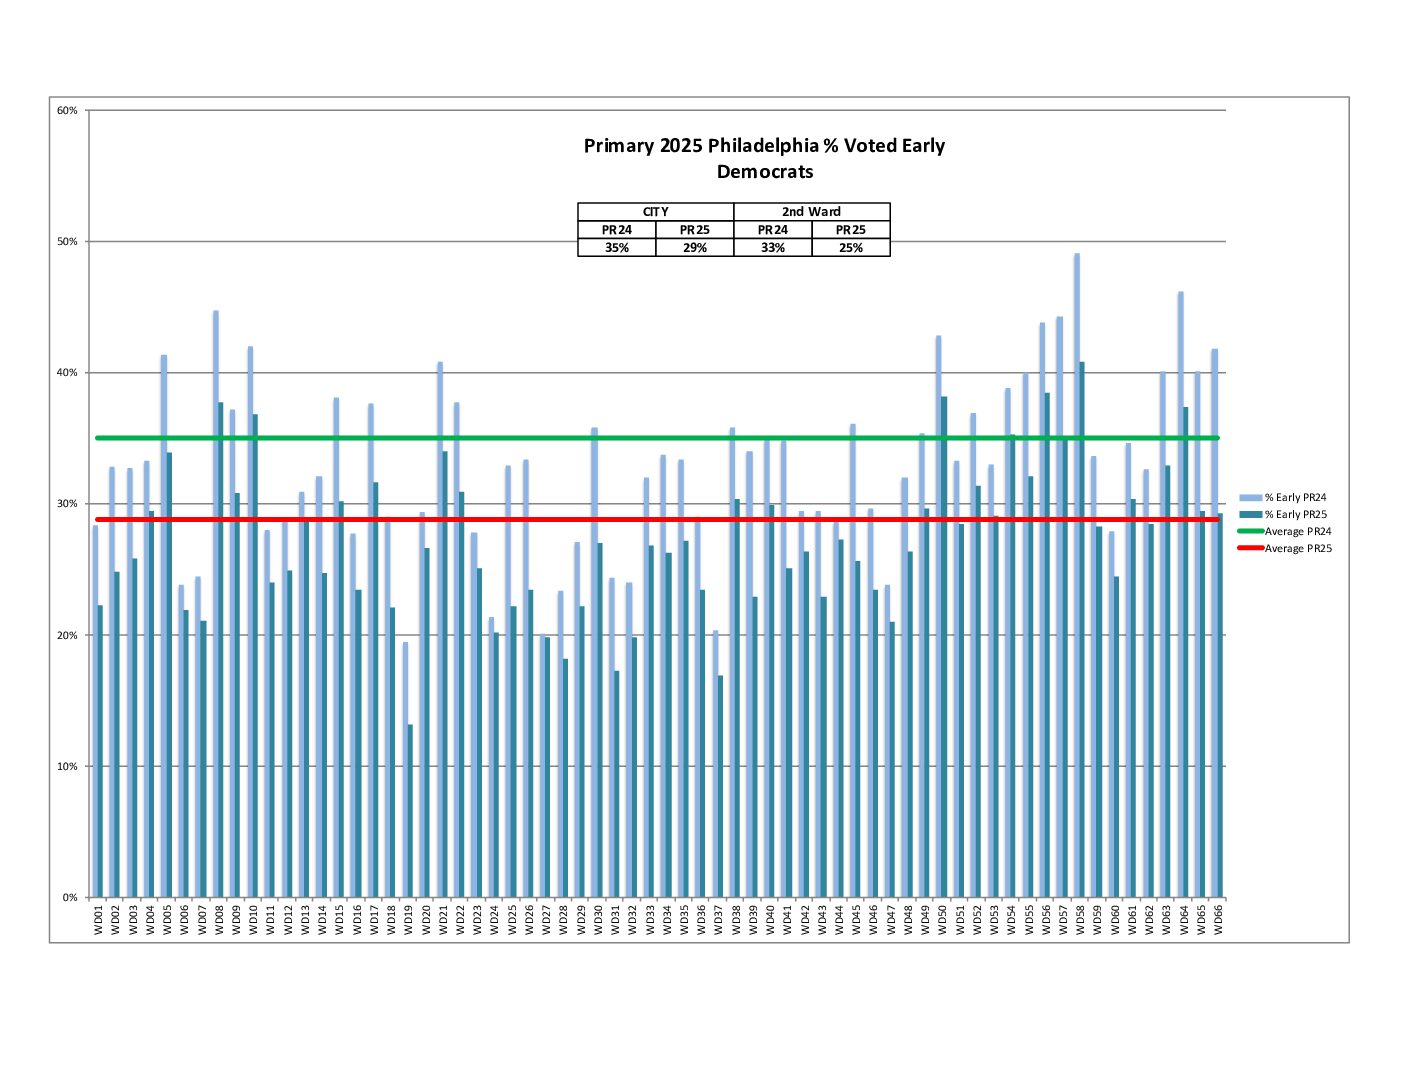
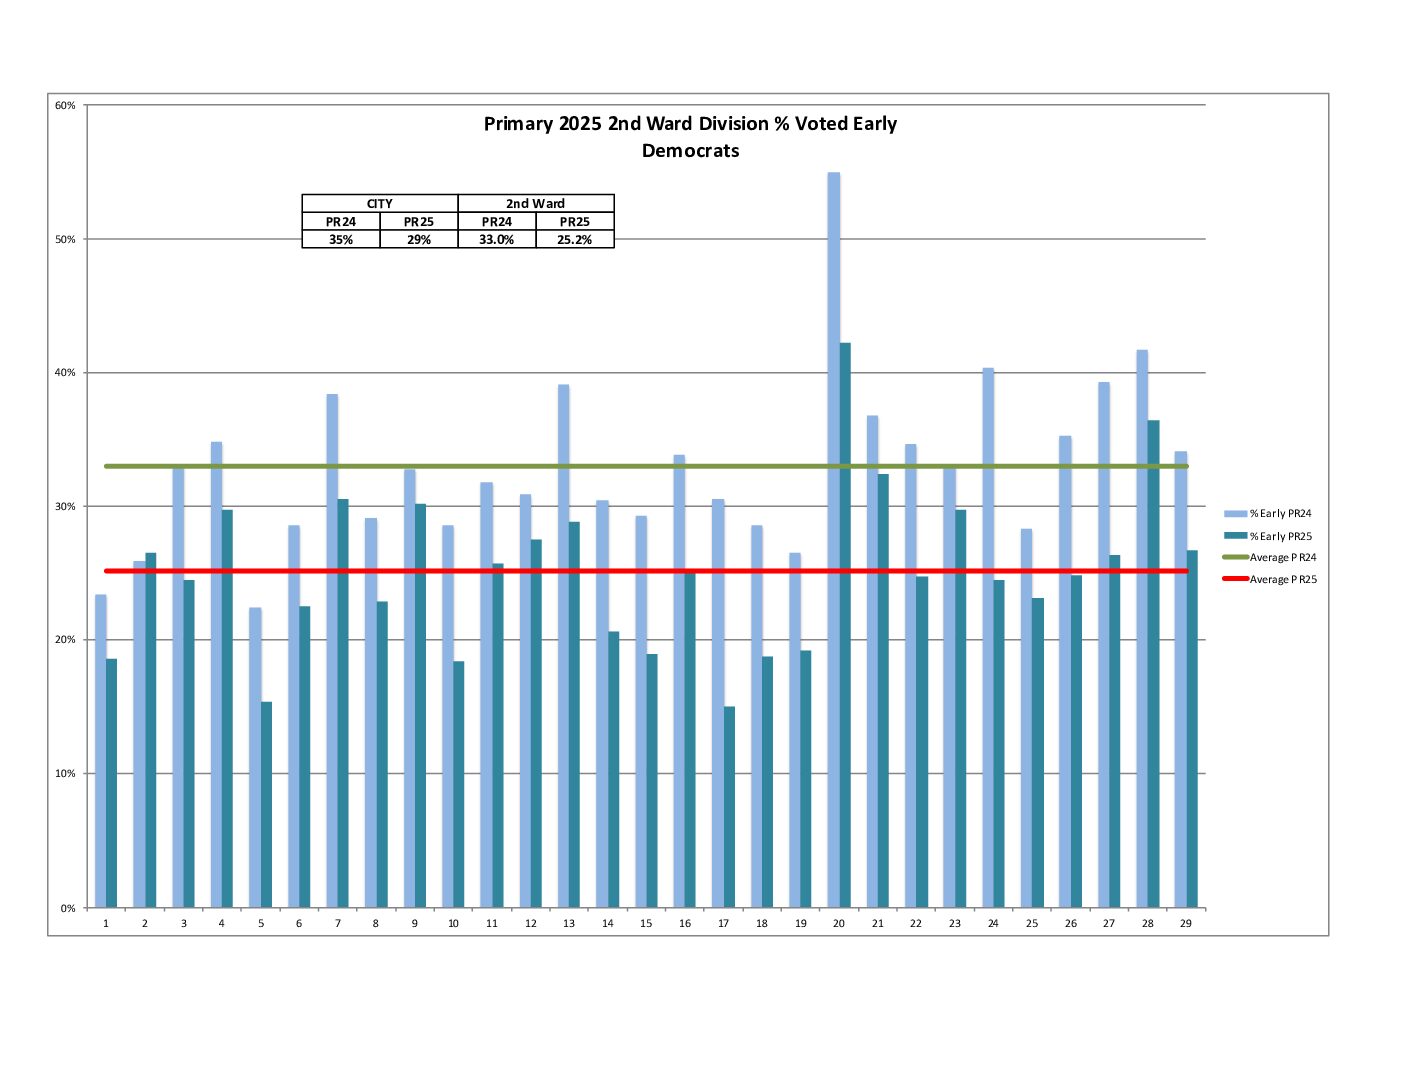
- Mail-in voting, Civilian overseas, Absentee
- Any voting method other than At Polls (AP)
The city voted about 4% earlier than the 2nd Ward.
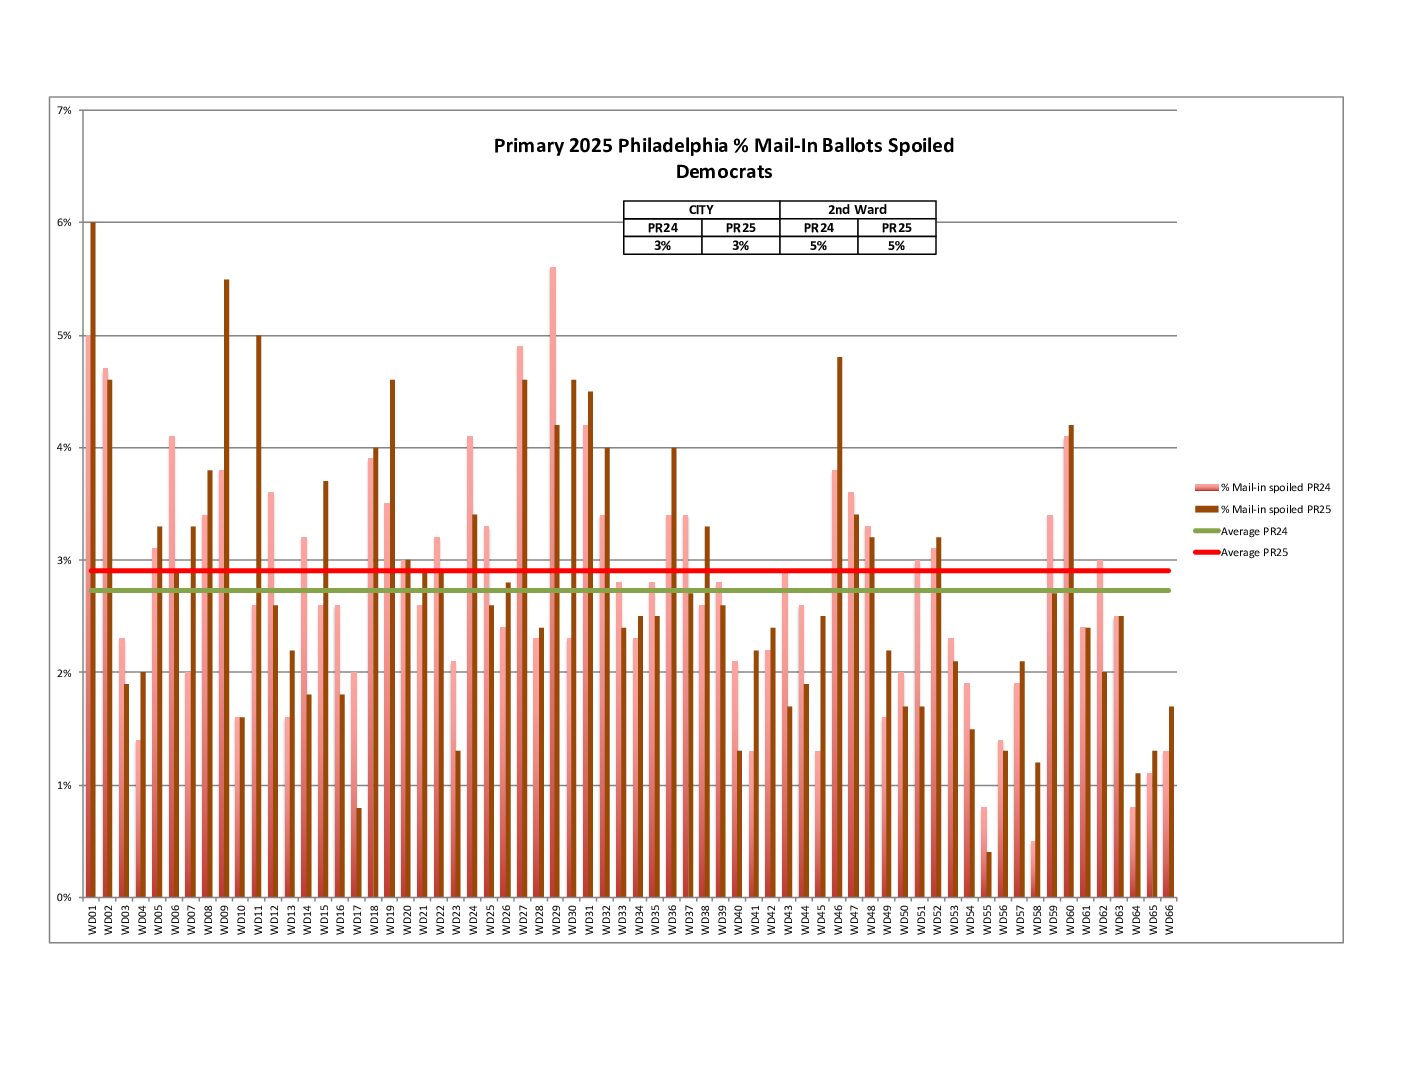
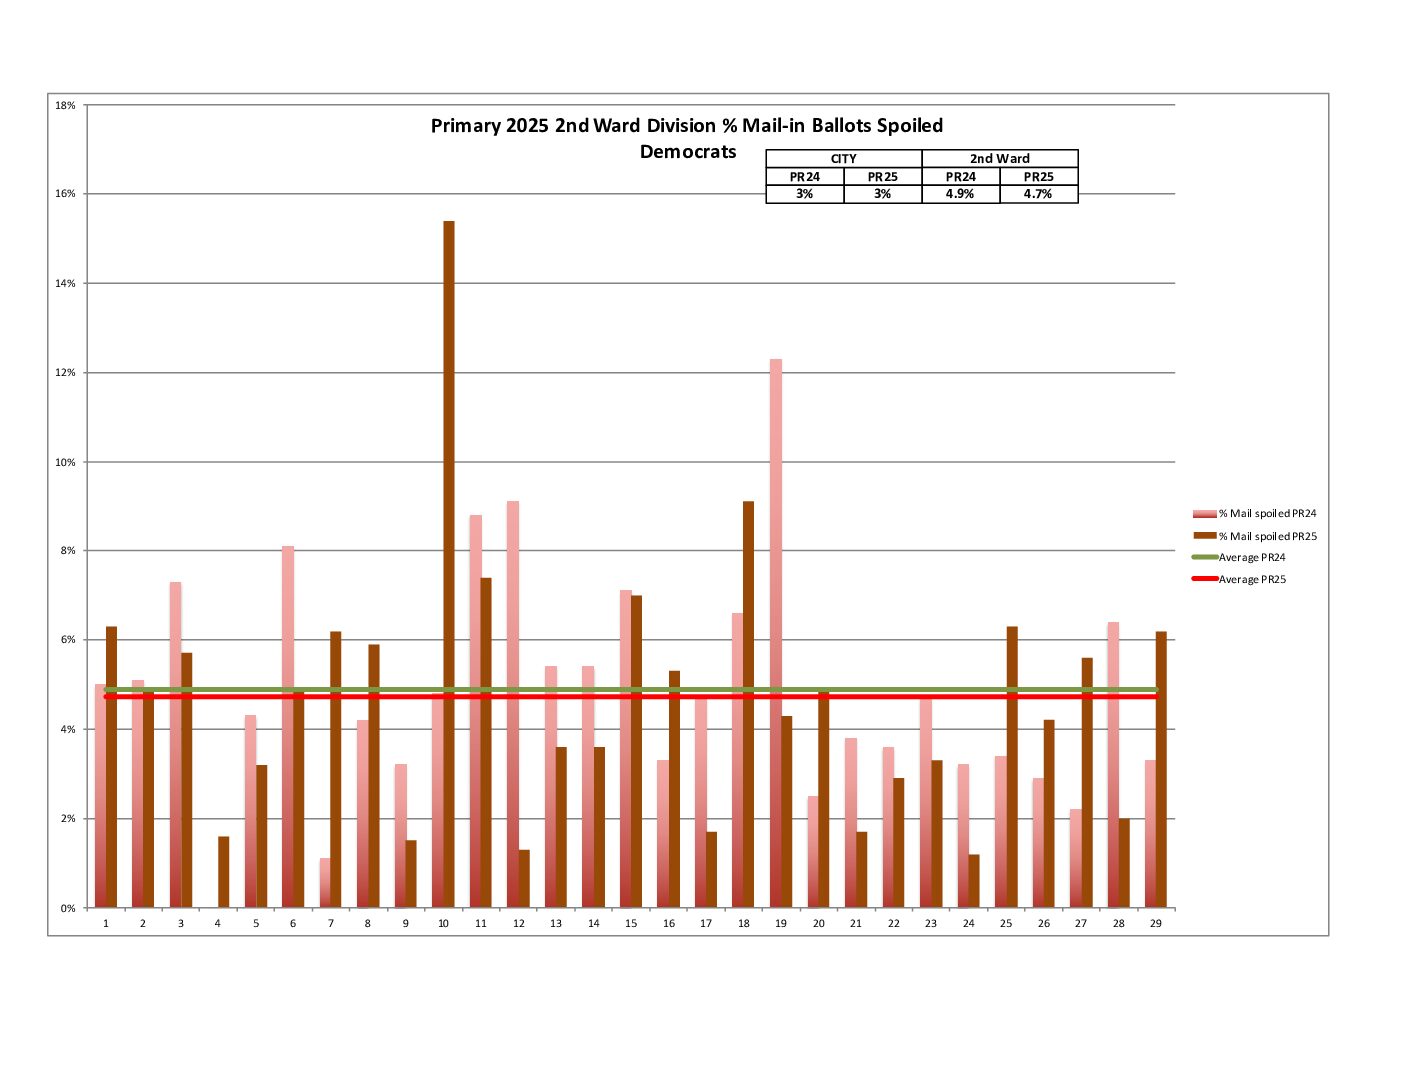
% Mail-in Ballots Spoiled
% Mail-in Ballots Unreturned

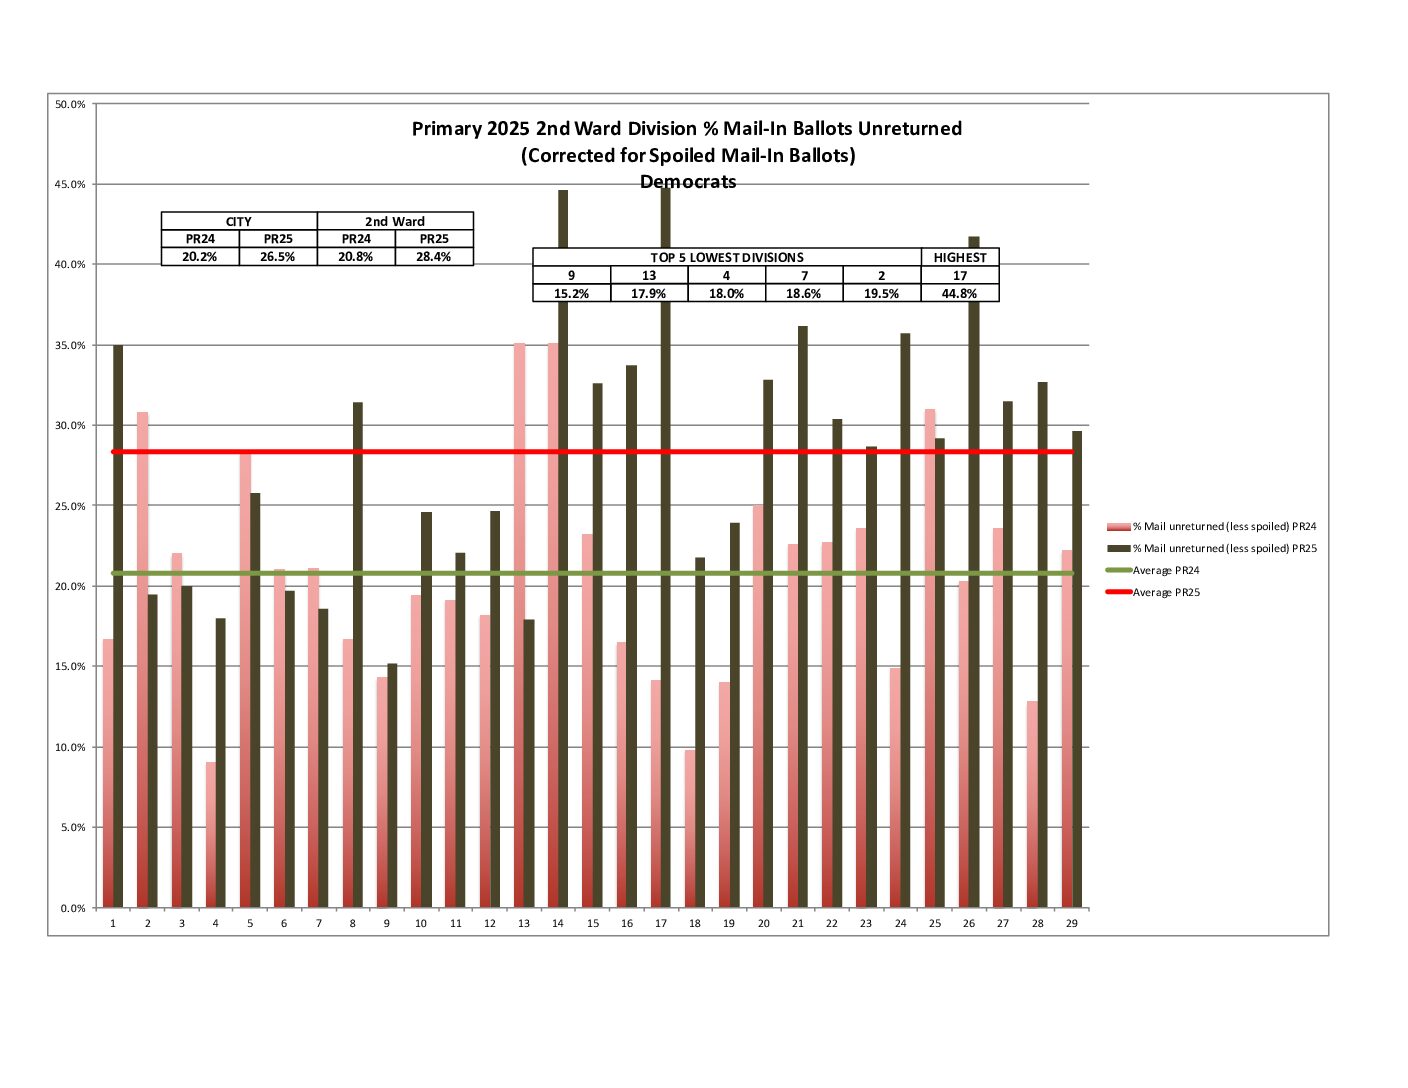
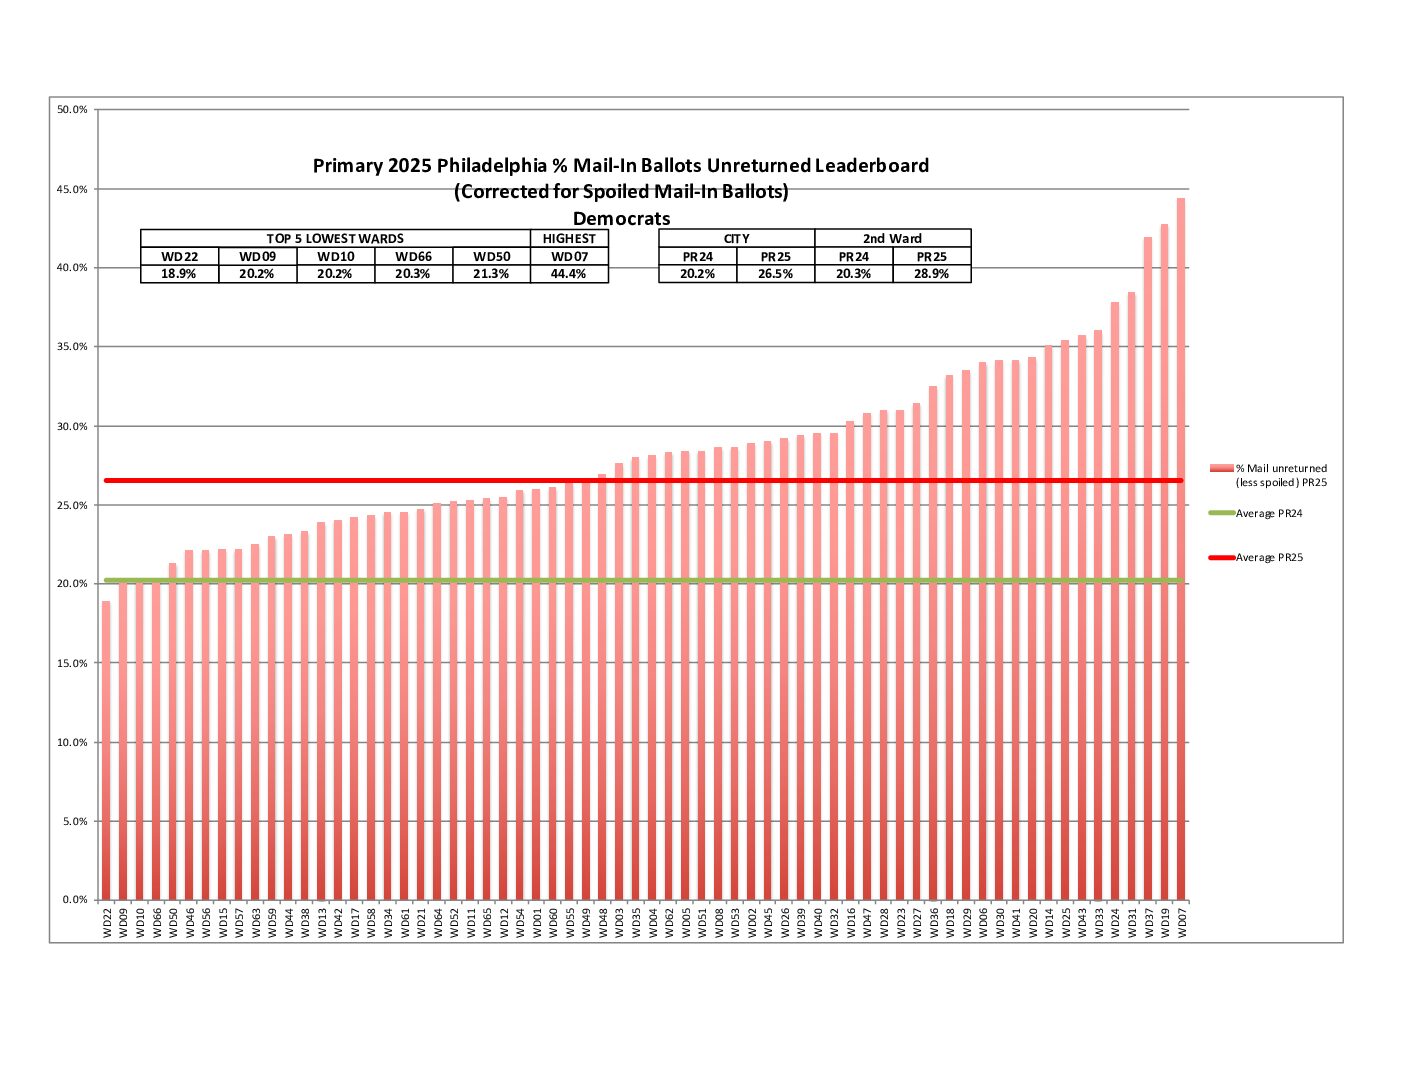
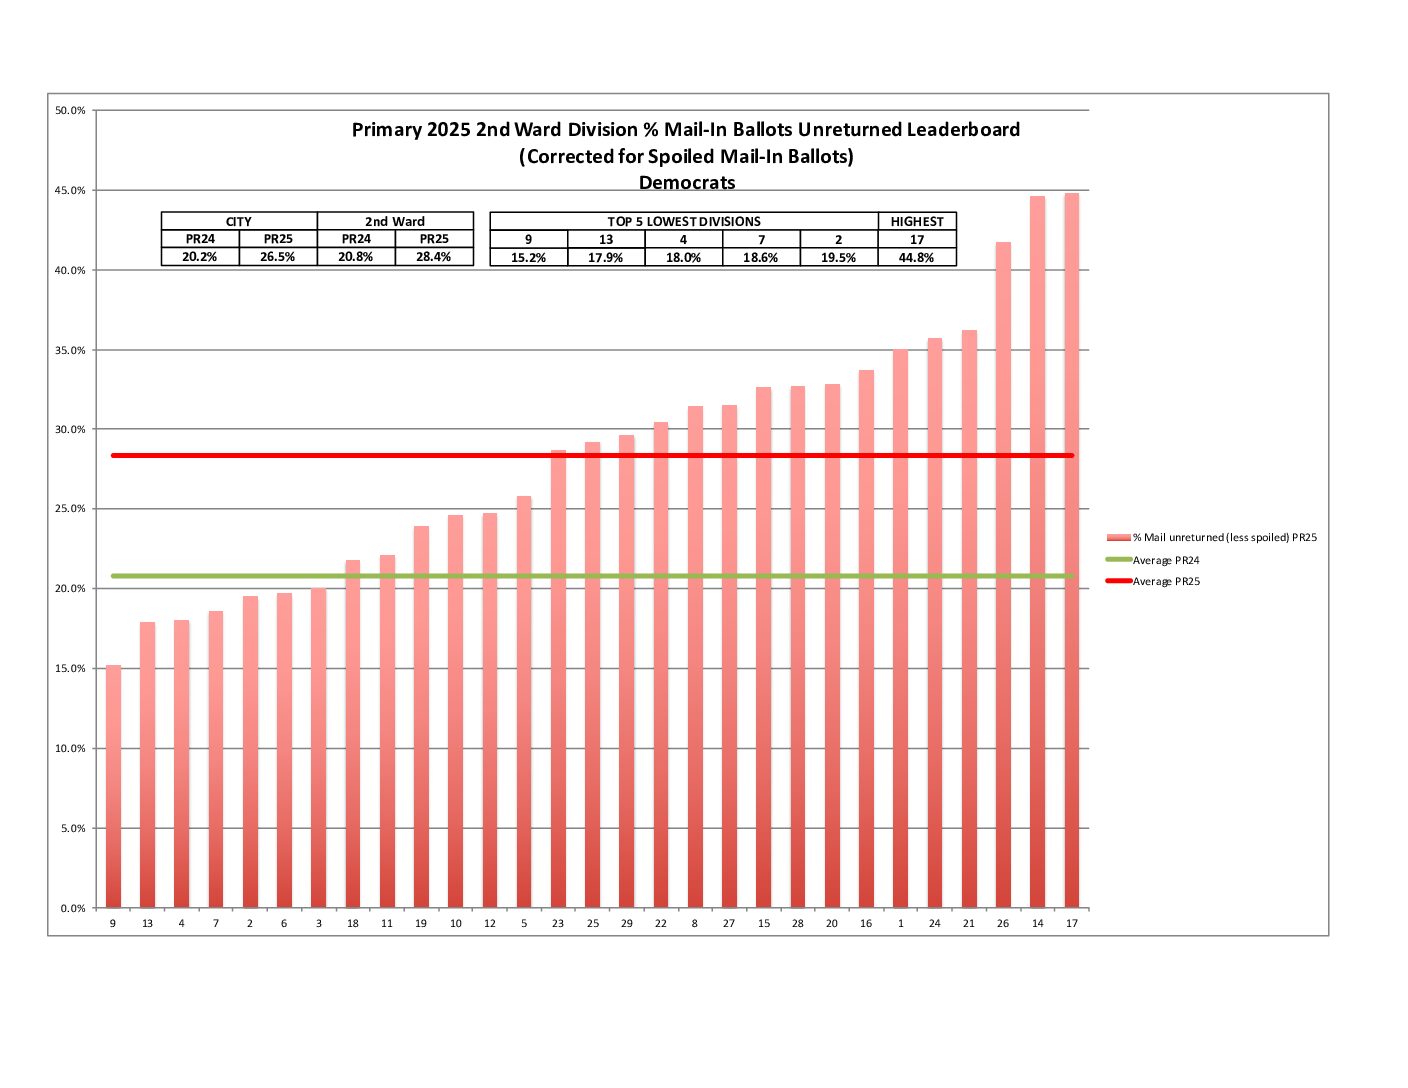
% Mail-in Ballots Unreturned Leaderboard
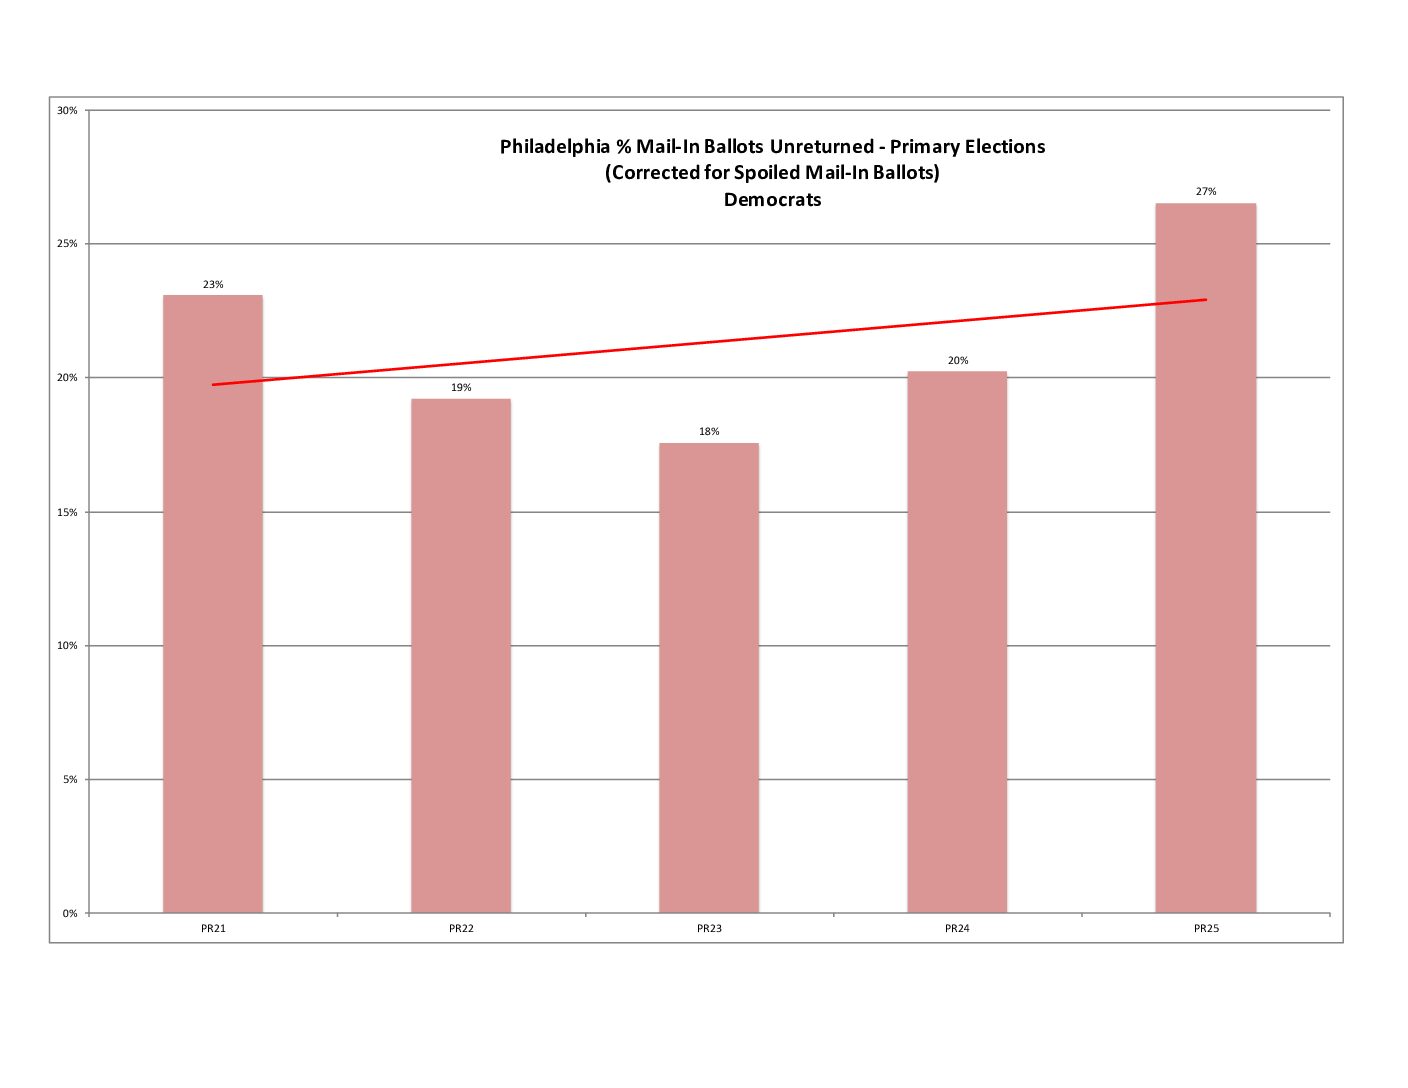
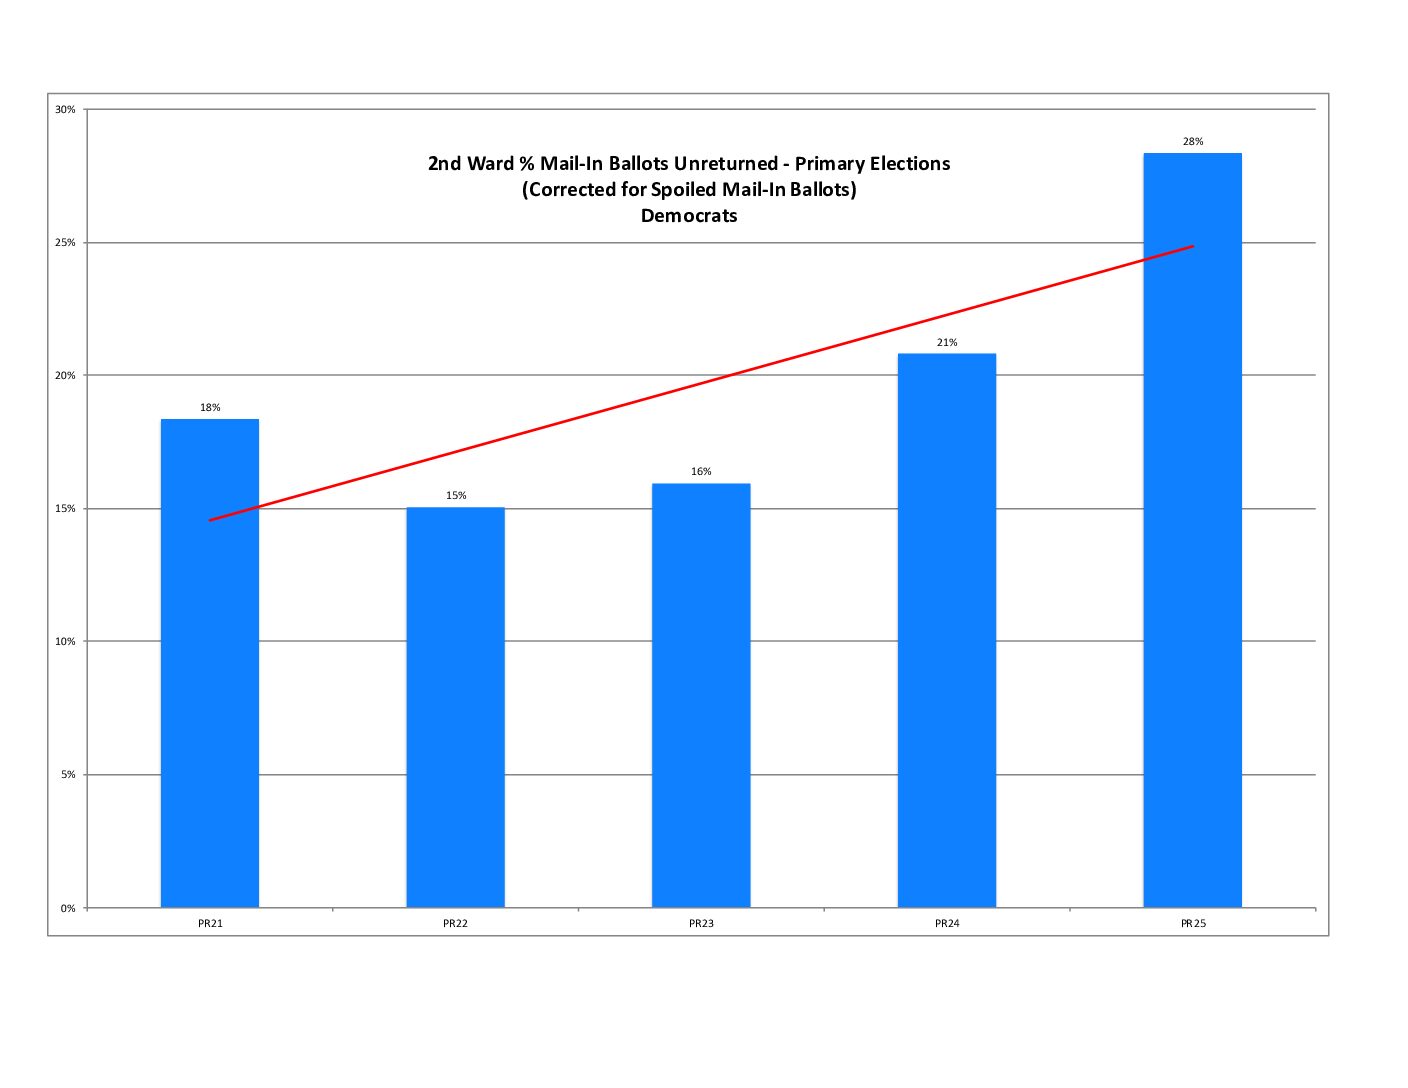
% Mail-in Ballots Unreturned History
Mail-in Ballots Unreturned
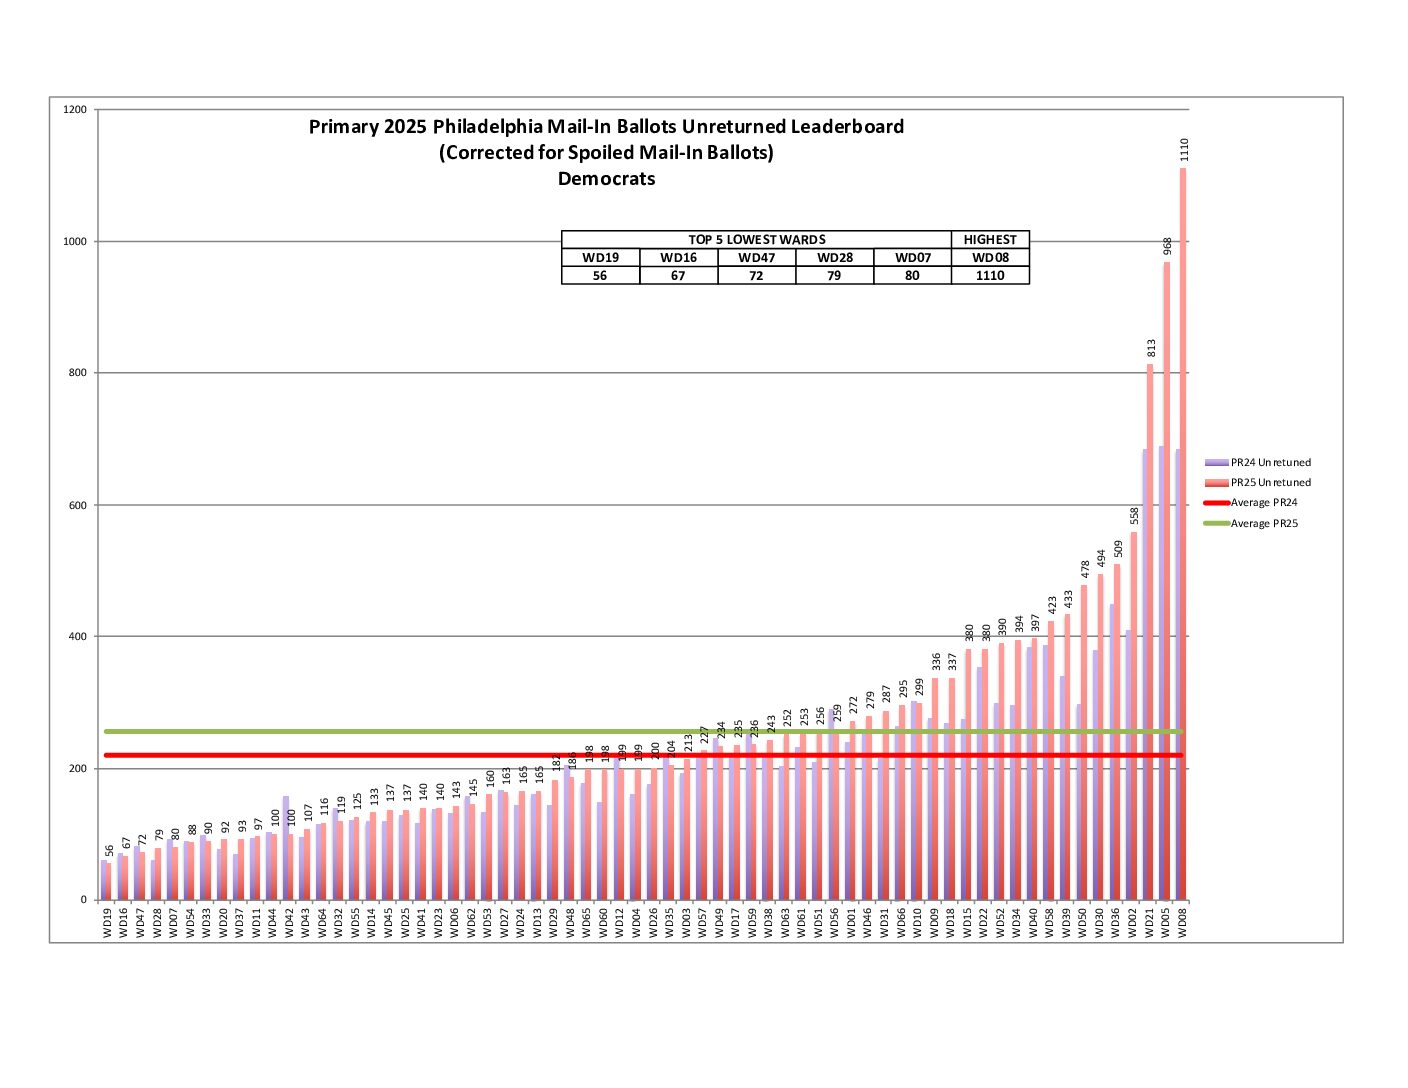
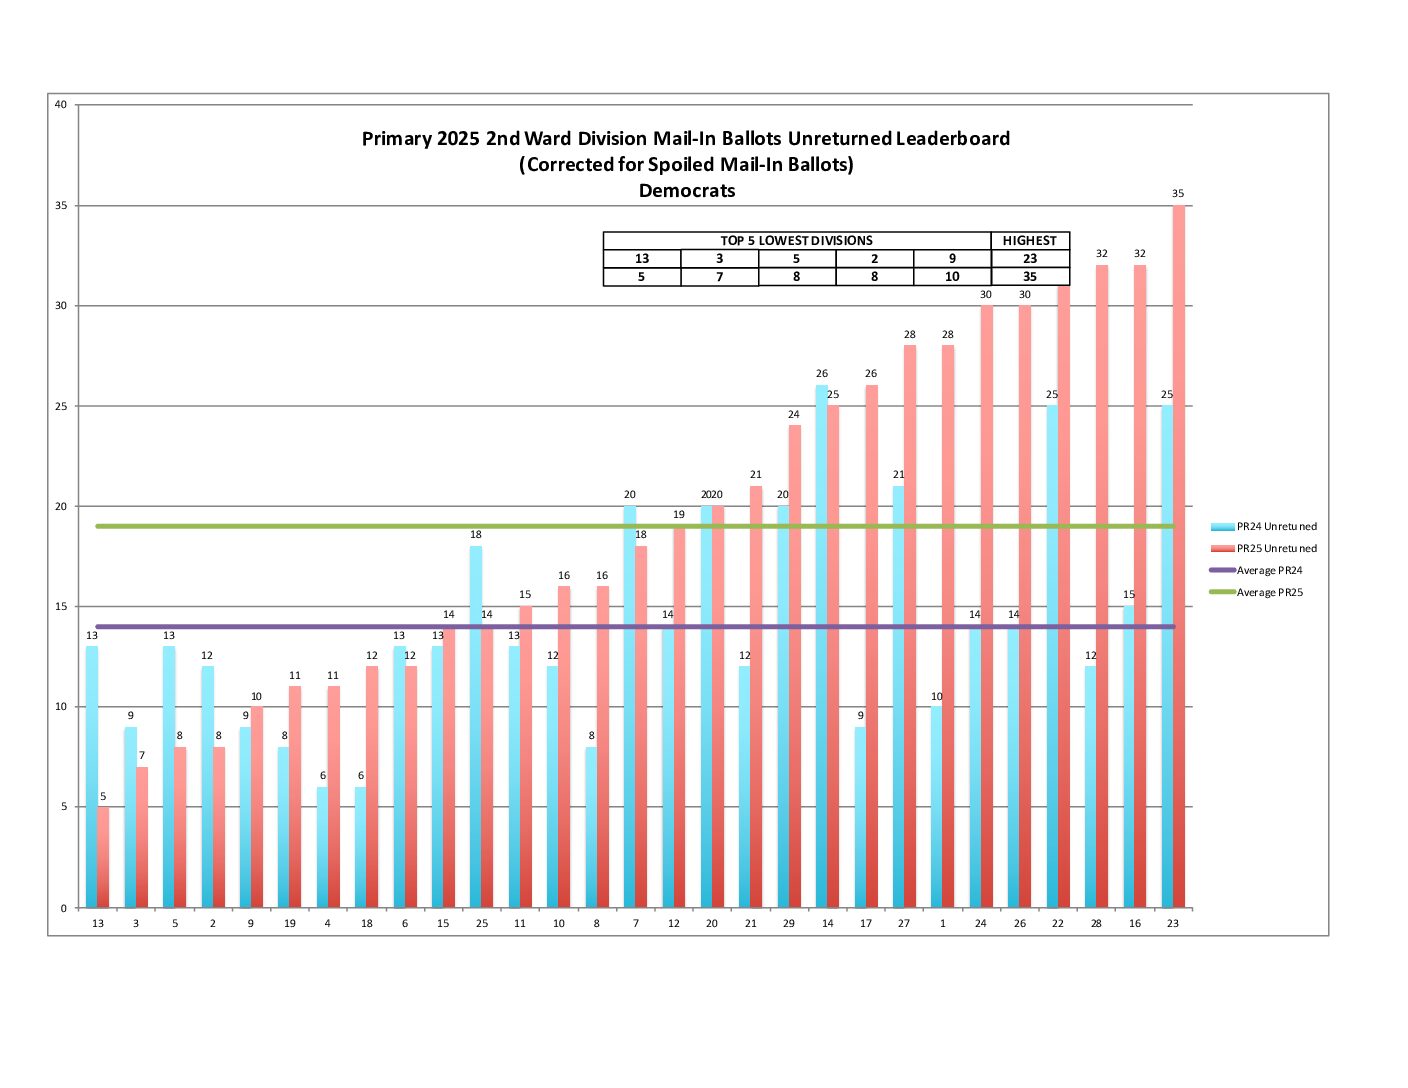
Mail-in Ballots Unreturned Leaderboard
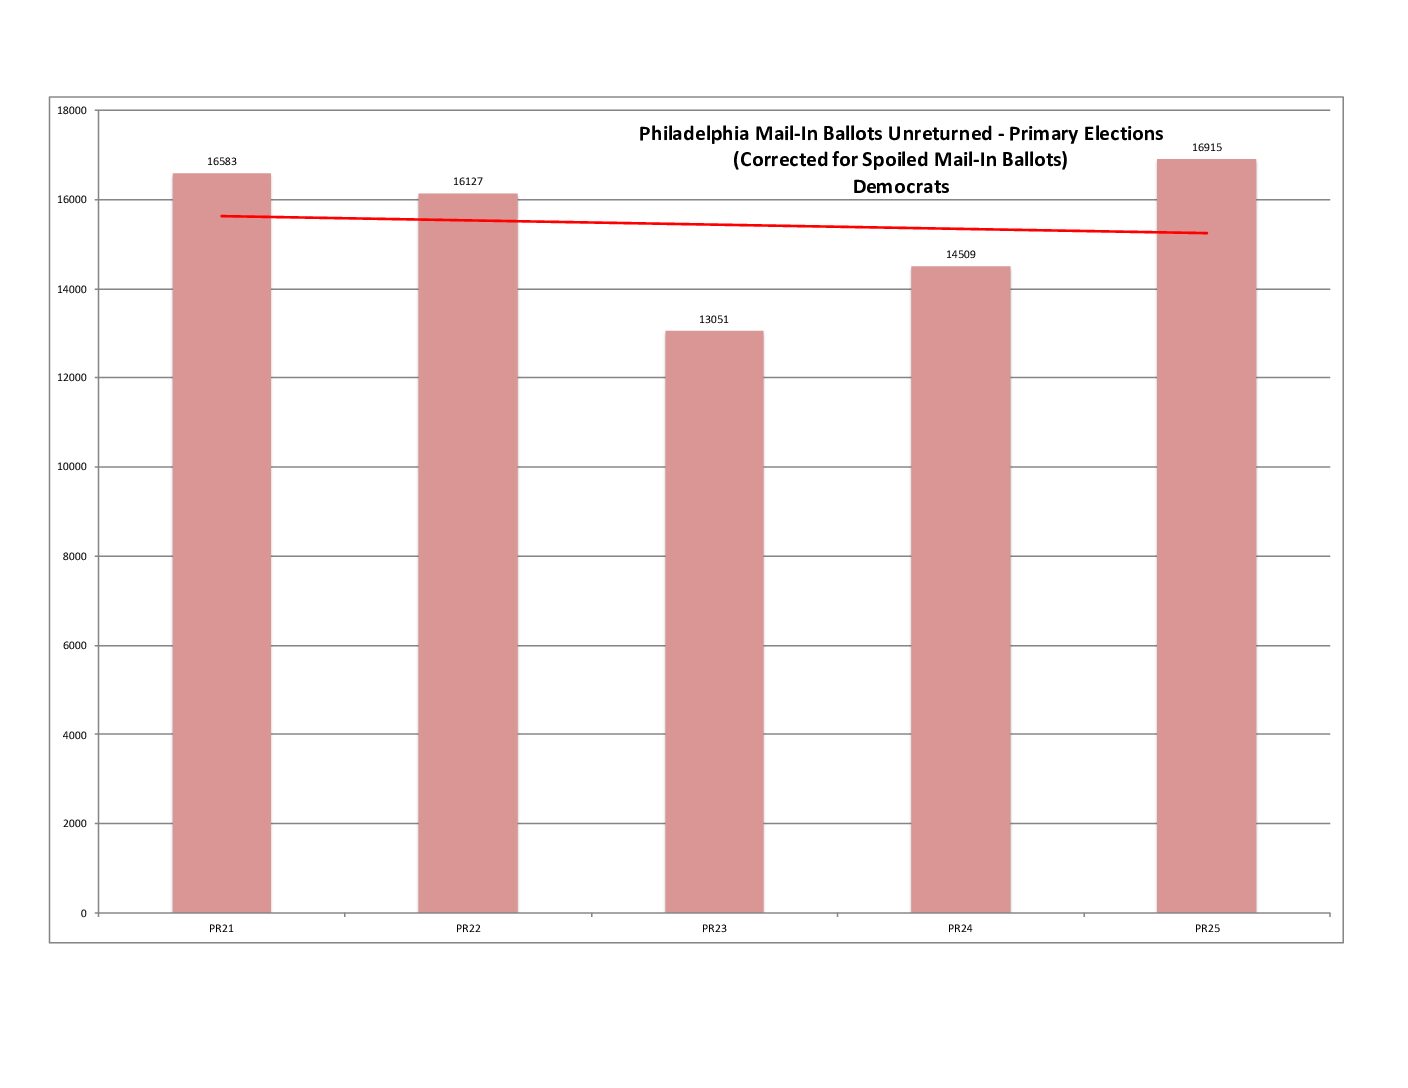
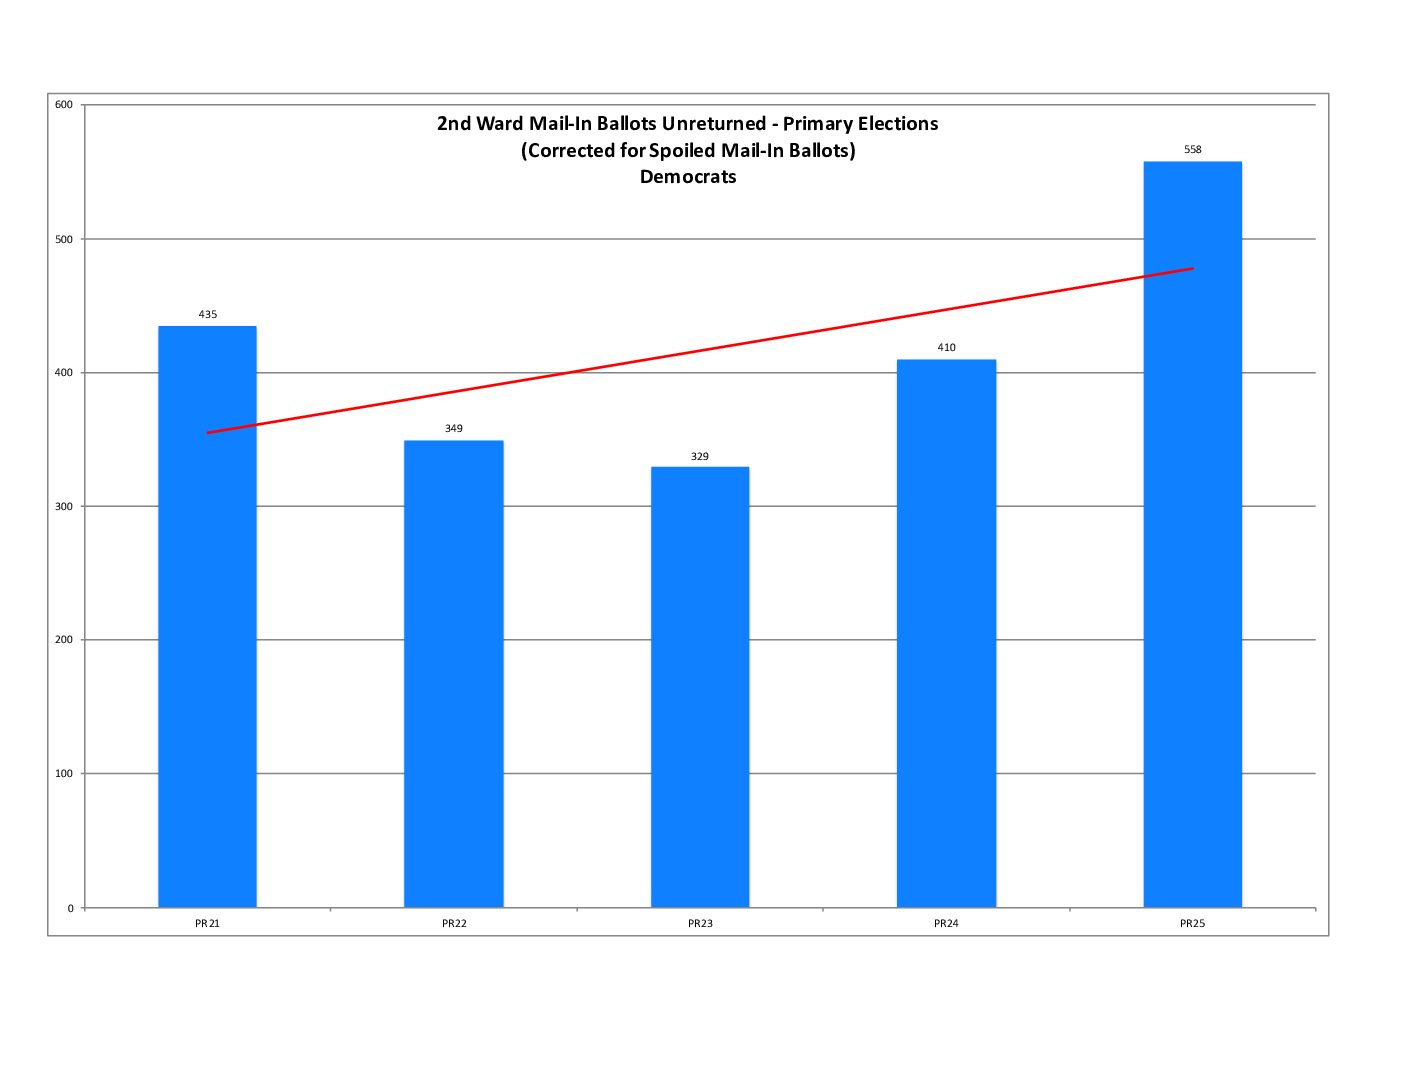
Mail-in Ballots Unreturned History
PSA: Don’t be one of these unreturned ballots! Never mail your ballot within one week of the election as it may not arrive in time. It must be RECEIVED by 8 PM on Election Day.
If you still have your ballot within one week of the election, always use a drop box – or bring your ballot to the polls. It will be spoiled (cancelled) and you will be allowed to vote on the machines.
If your ballot was not received by Election Day, or you don’t think you mailed it in time, come to the polls and vote provisionally. That way, your vote will count no matter what.
% Change in Turnout from Last General
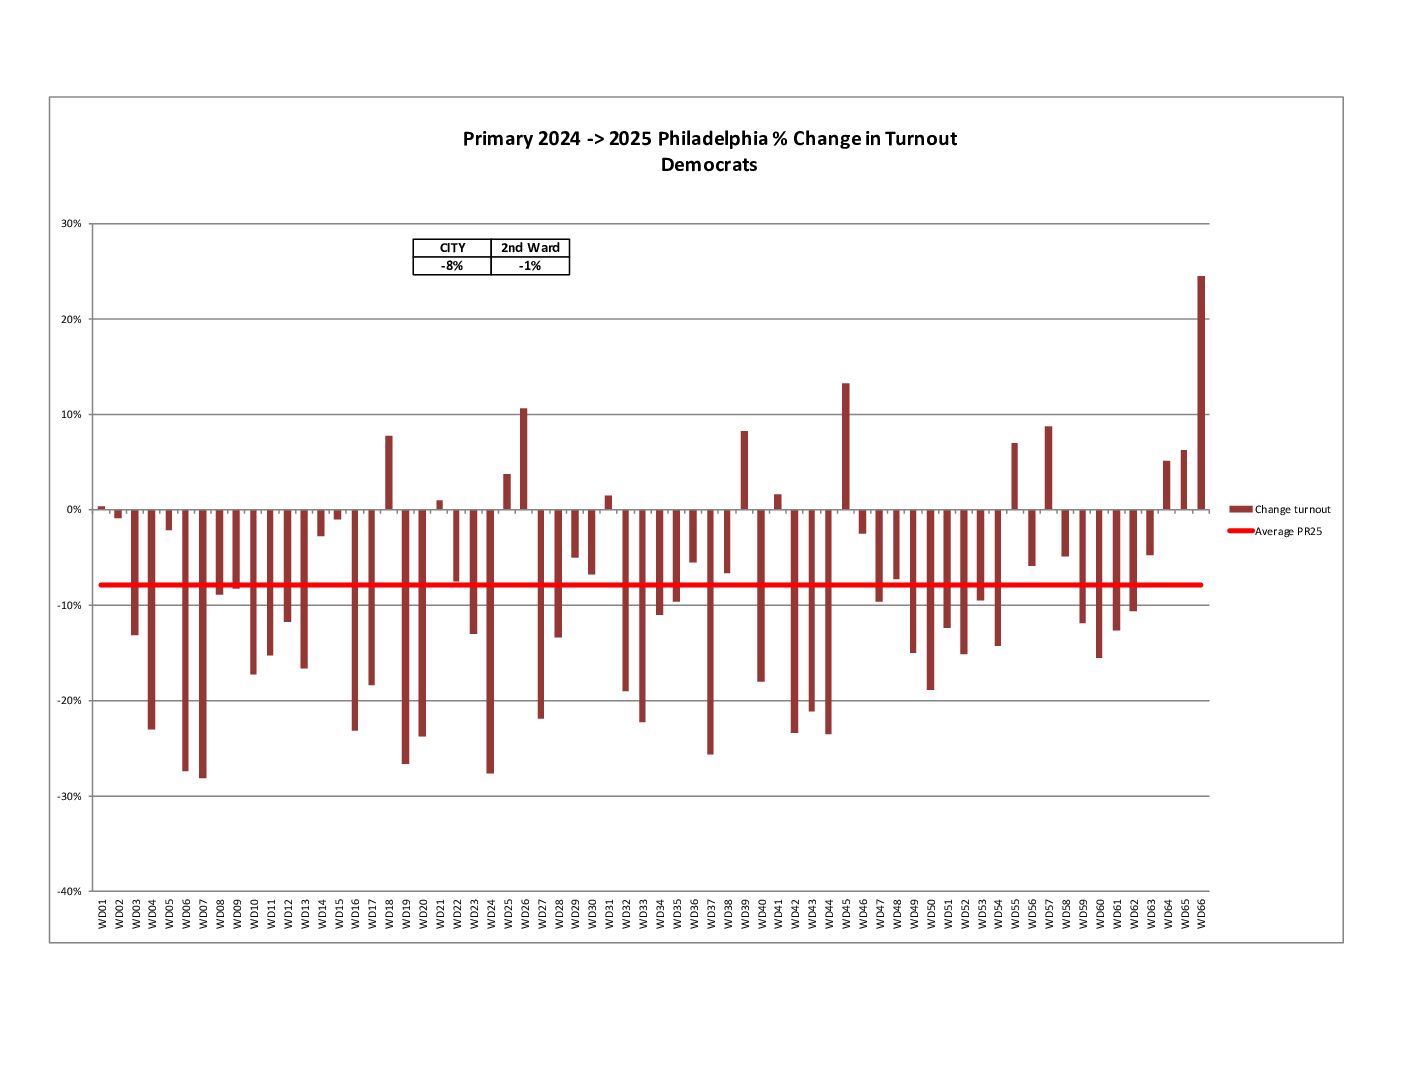
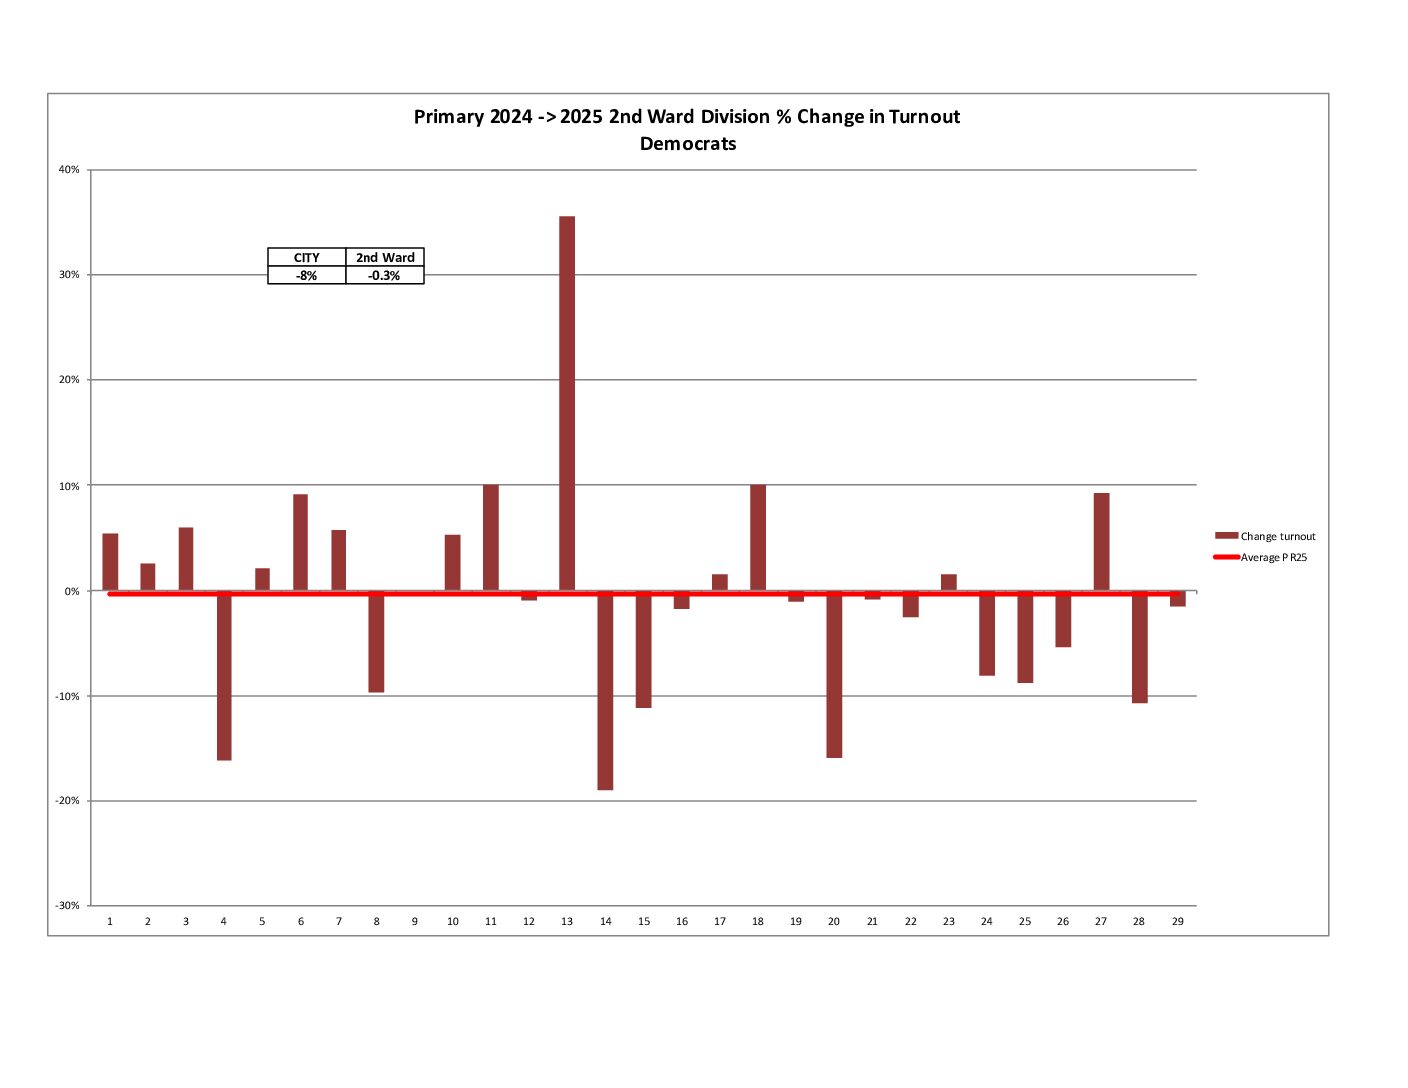
If we look at percent change in turnout between the primary elections of 2024 and 2025, voter turnout was mostly down.
Endorsements
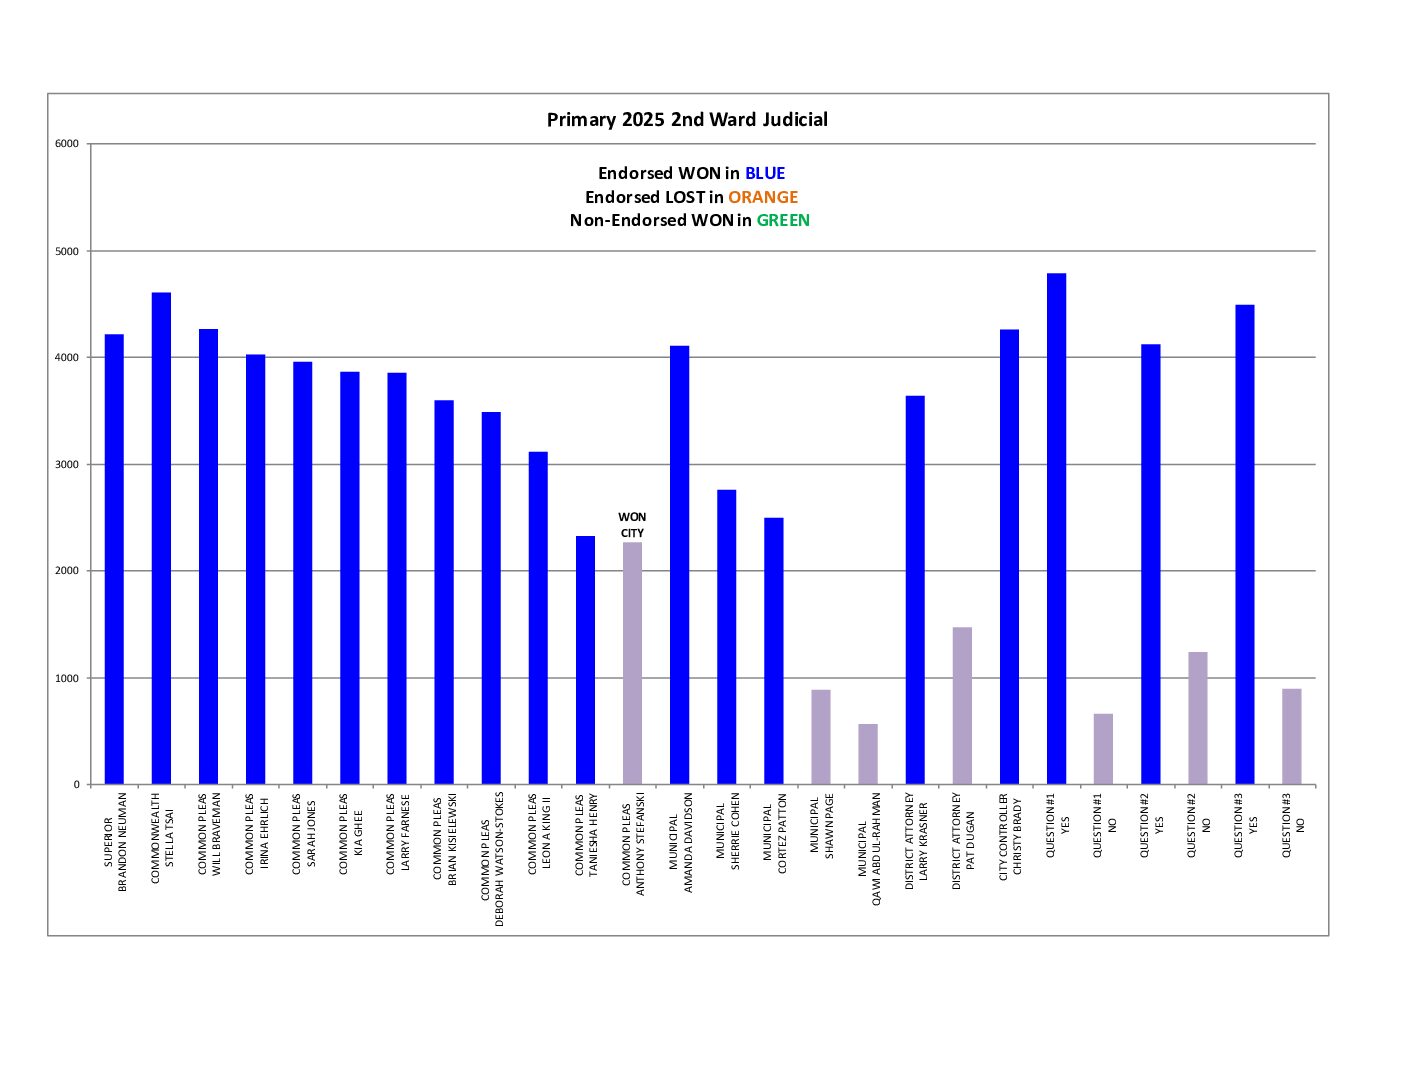
We carried all of our endorsed candidates and ballot question positions in the 2nd Ward. Everyone won citywide except Taniesha Henry who was bested by Anthony Stefanski for Court of Common Pleas.
Thanks for reading!
Related Posts