The numbers are in!
Quick Links
Have you ever wondered how the 2nd Ward performed in Philadelphia when compared to other wards? How about your particular division? Well, you’ve come to the right place. The official voter file is in and we’ve crunched the numbers.
Important notes:
- All statistics have been rounded up or down. So, some numbers may appear to be a statistical dead heat.
- All charts reflect registered Democrats.
- The image sliders show Philadelphia on the left and the 2nd Ward on the right.
So, let’s dive in…
% Turnout
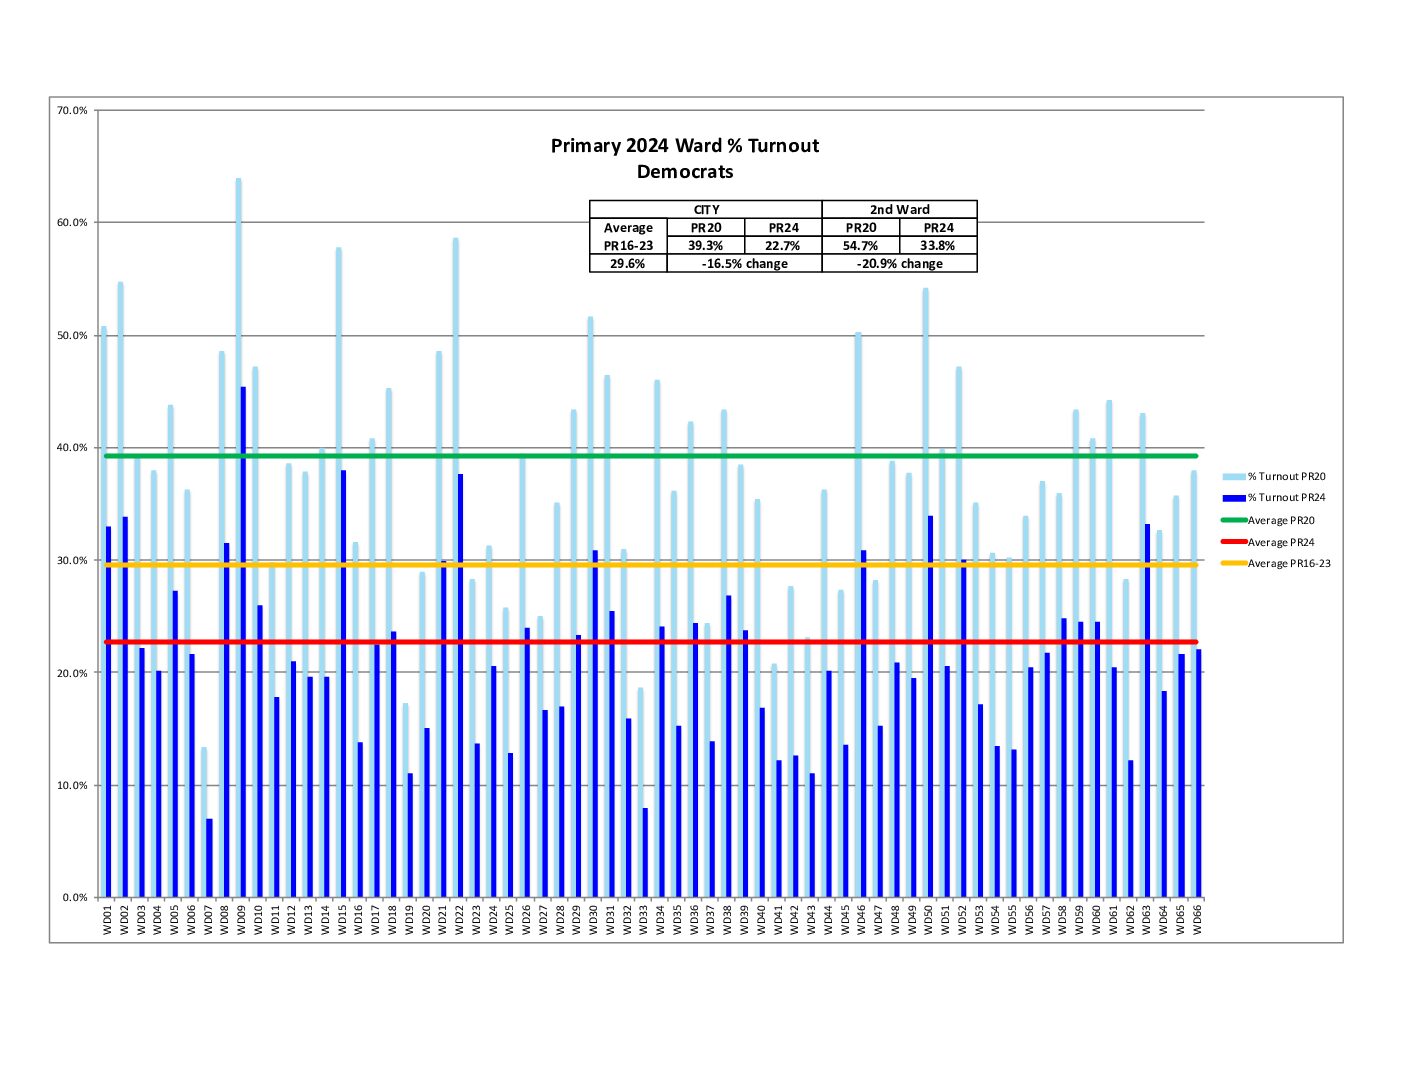
We beat the city percent turnout by about 11%. Unfortunately, turnout was way down across the board compared to the last comparable primary in 2020. Check out the leaderboard below for how we finished city-wide and also for how our divisions performed.
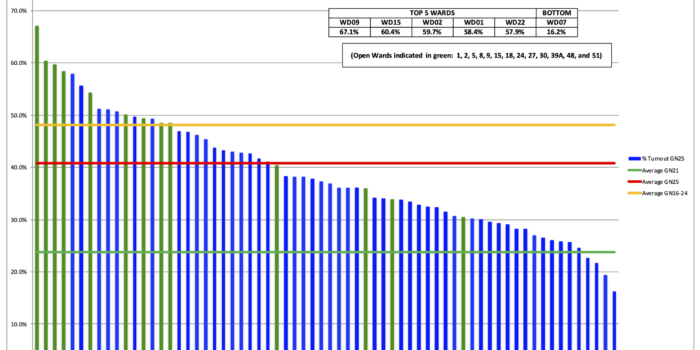
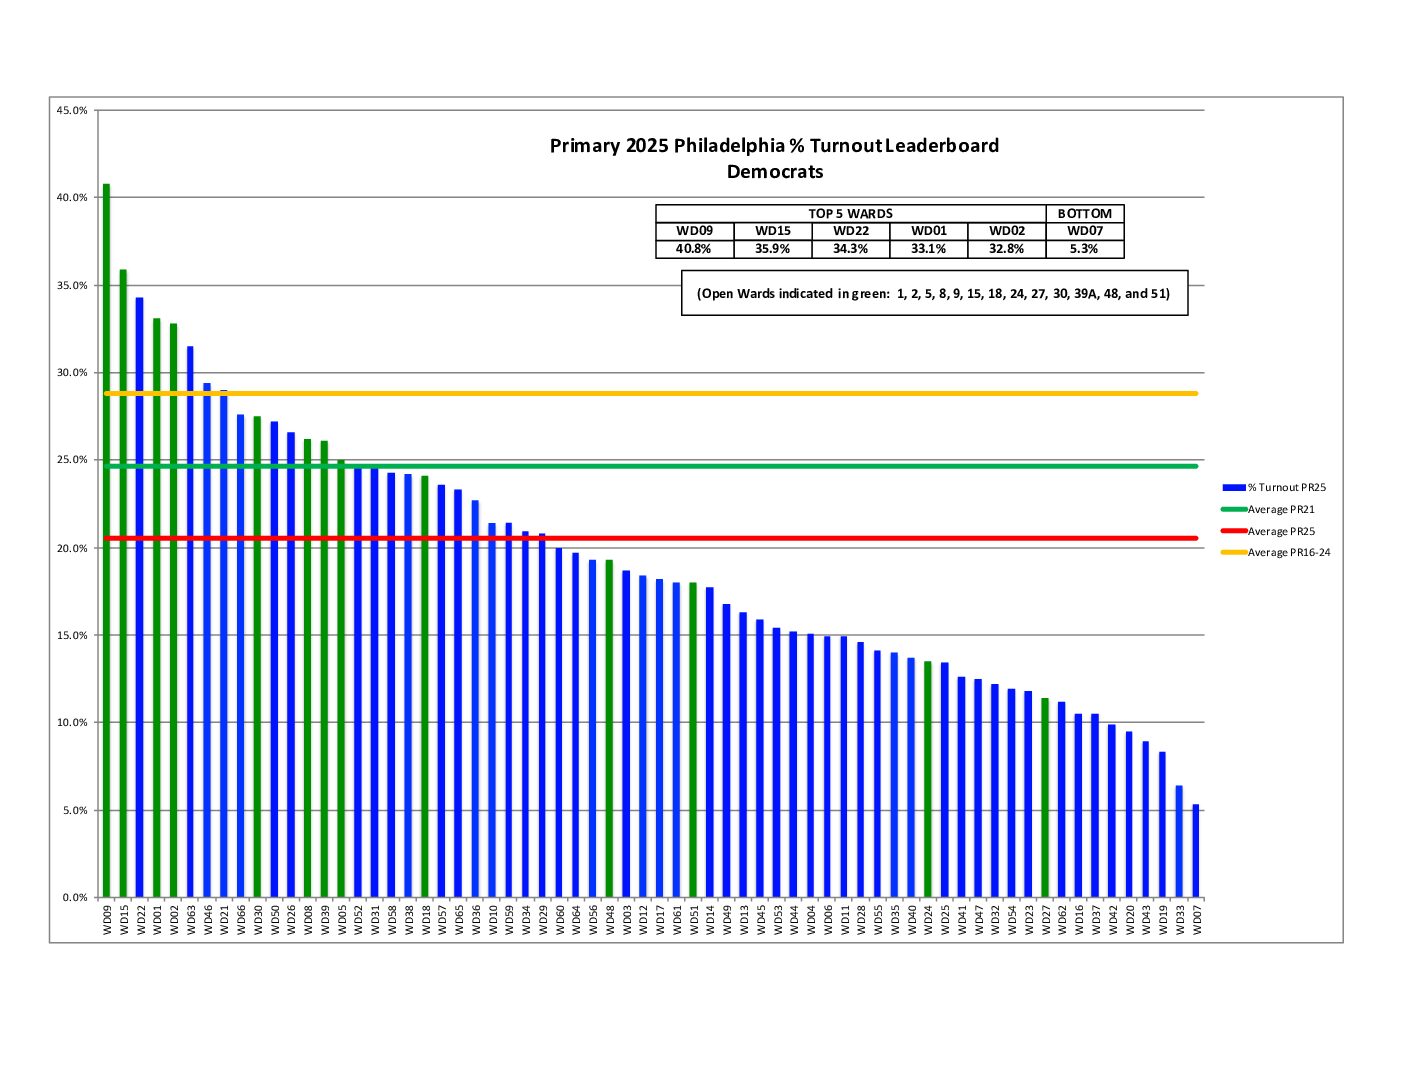
% Turnout Leaderboard

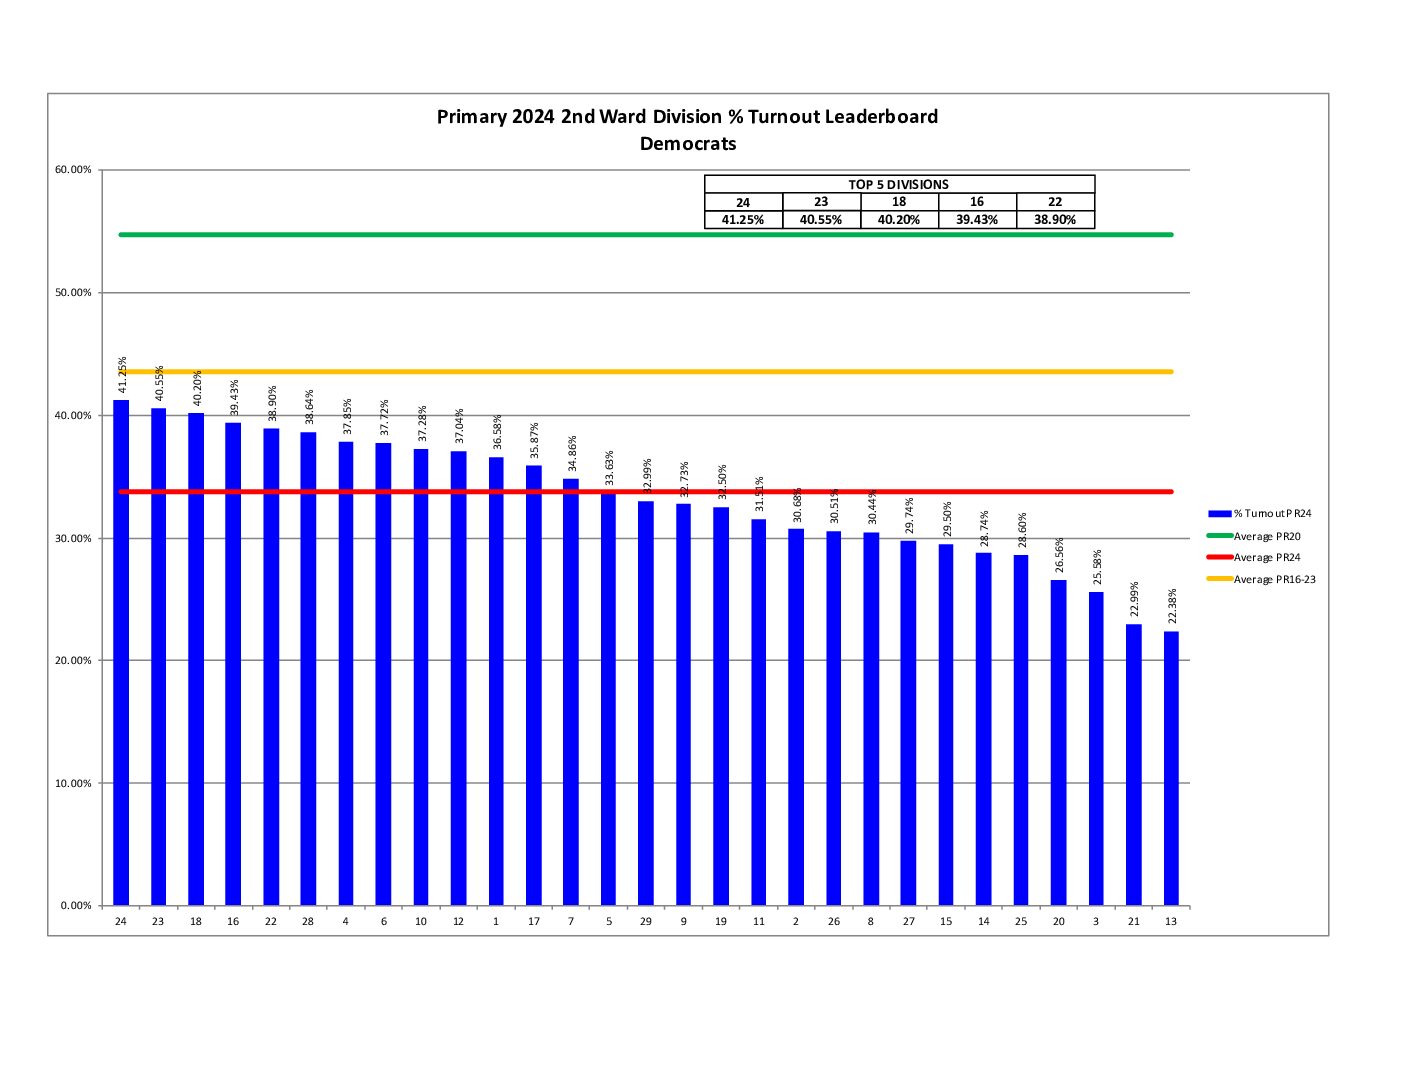
We came in 5th in the city, almost tying for 4th, and only about 4% away from the 15th Ward in 2nd place. (Please note the Open Wards shown in green. What’s an Open Ward?)
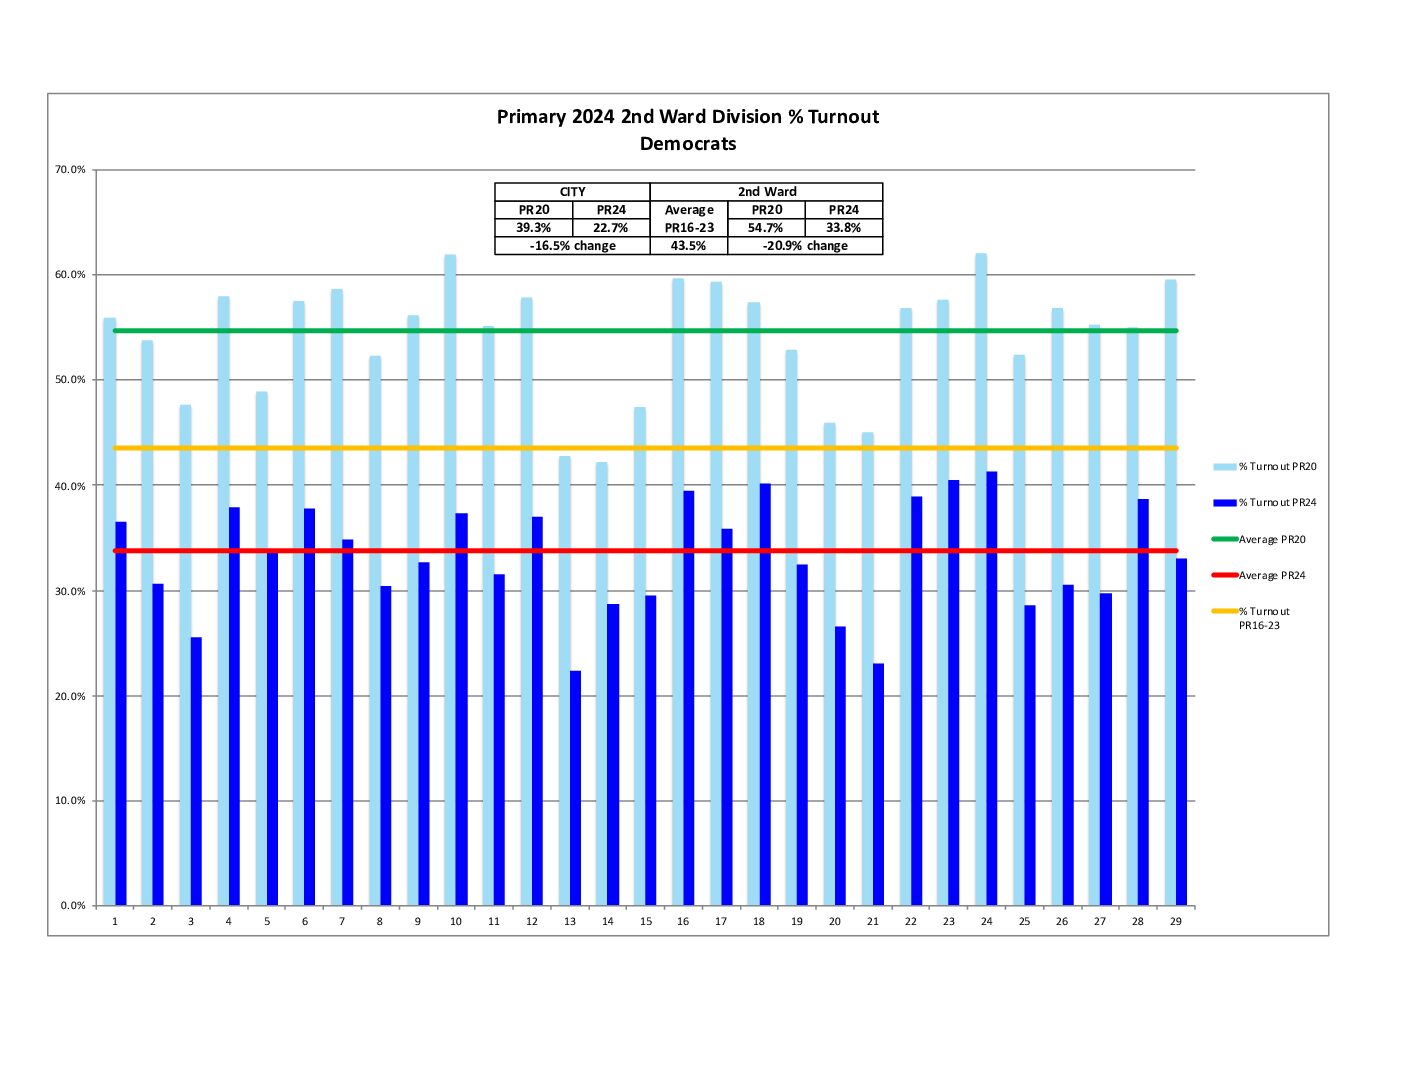
For the top five spots in the 2nd Ward, Division 24 came in first, followed by 23, 18, 16, and 22.
Turnout Leaderboard
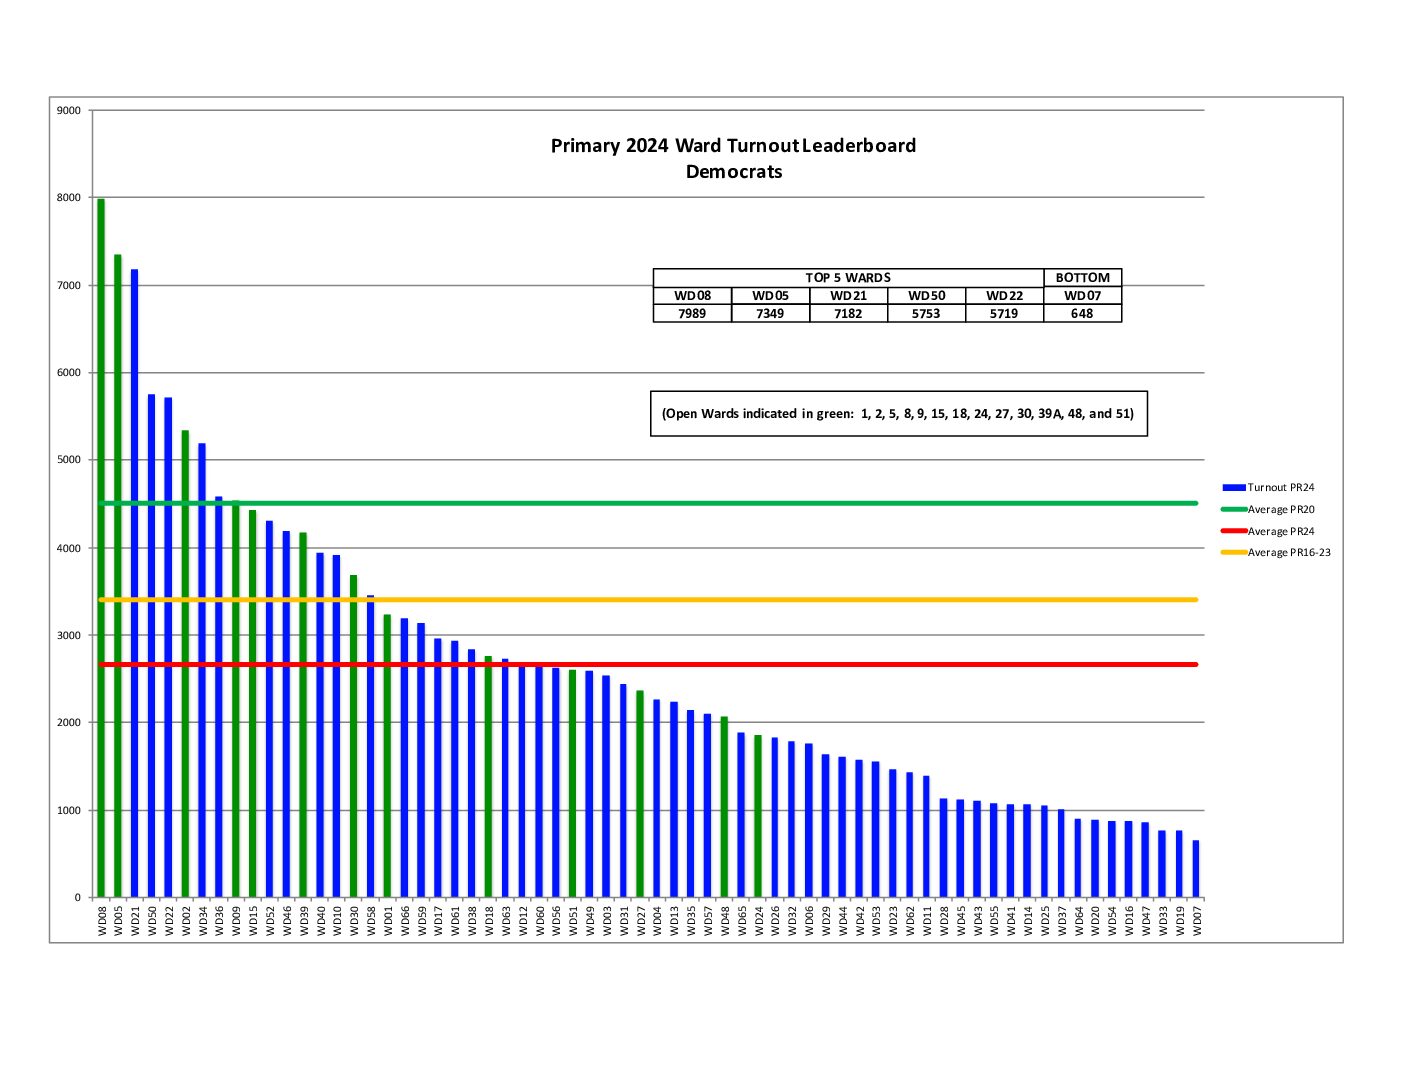
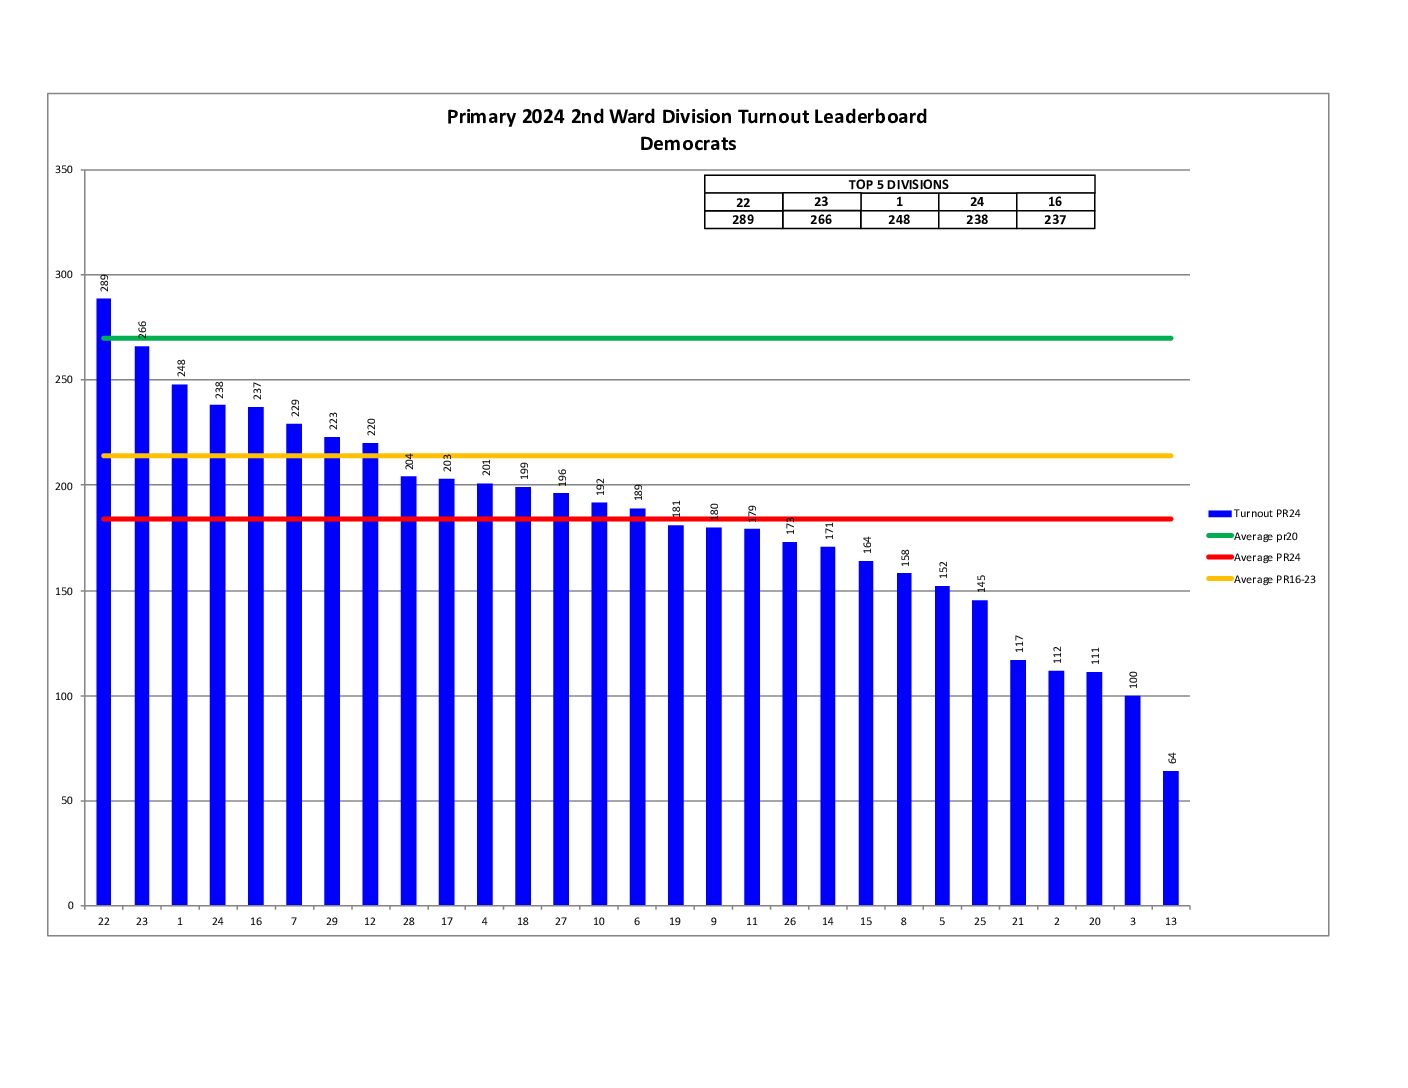
Ever wonder which ward or division has the most clout in terms of generating raw votes? The 2nd Ward was 6th in the city. (Please note the Open Wards shown in green. What’s an Open Ward?)
Turnout History
% Turnout
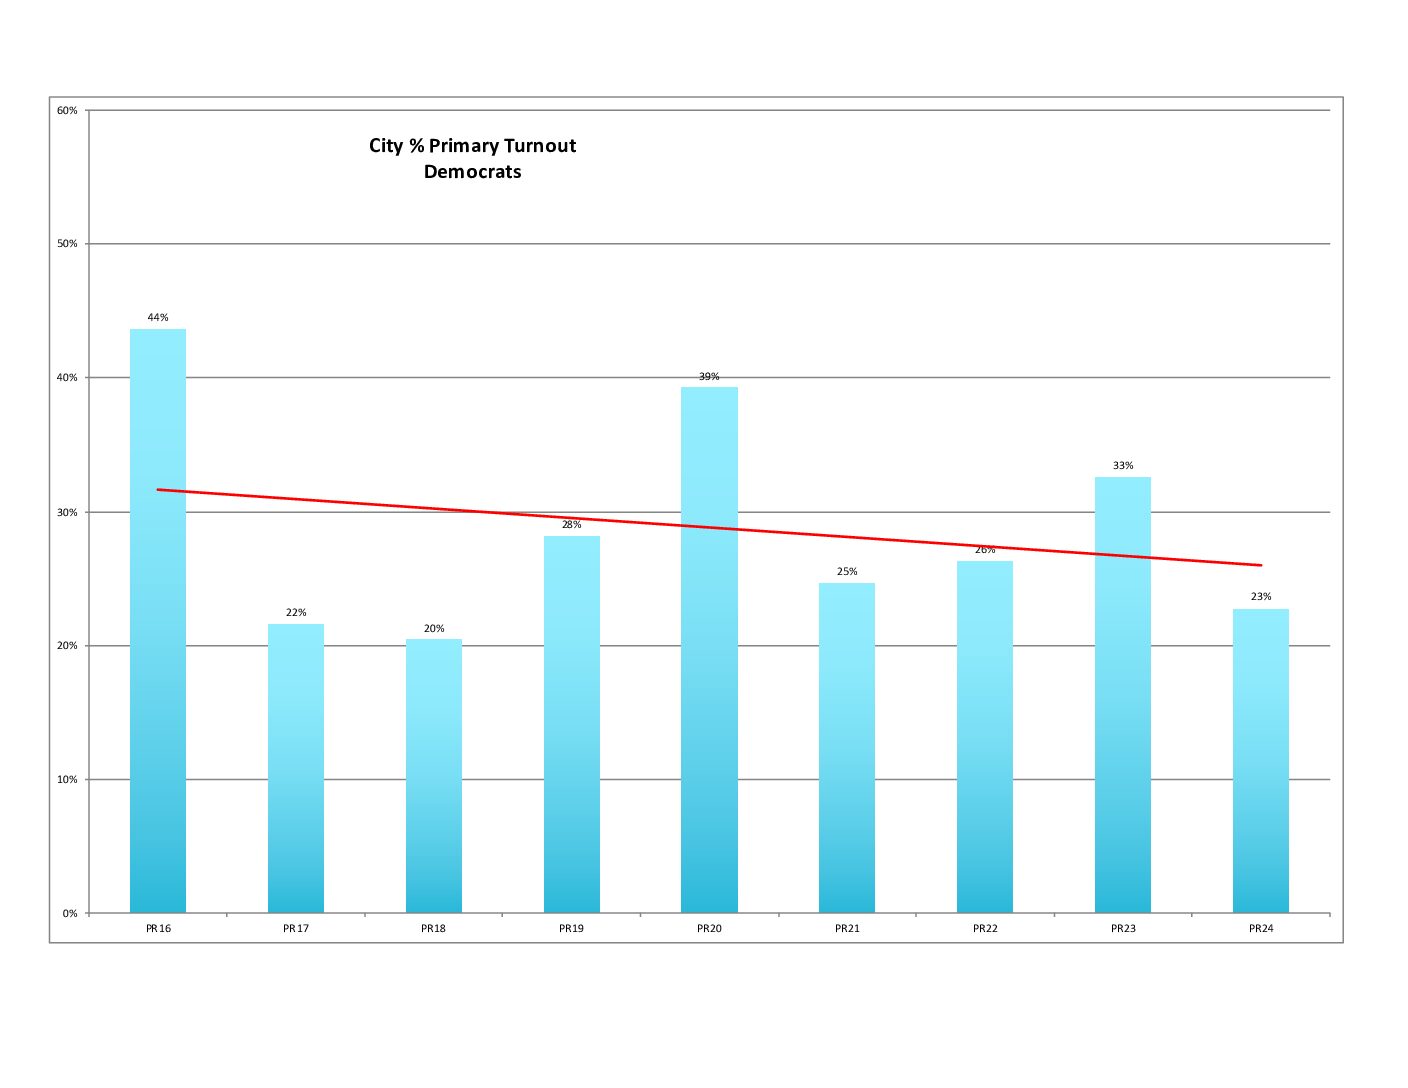
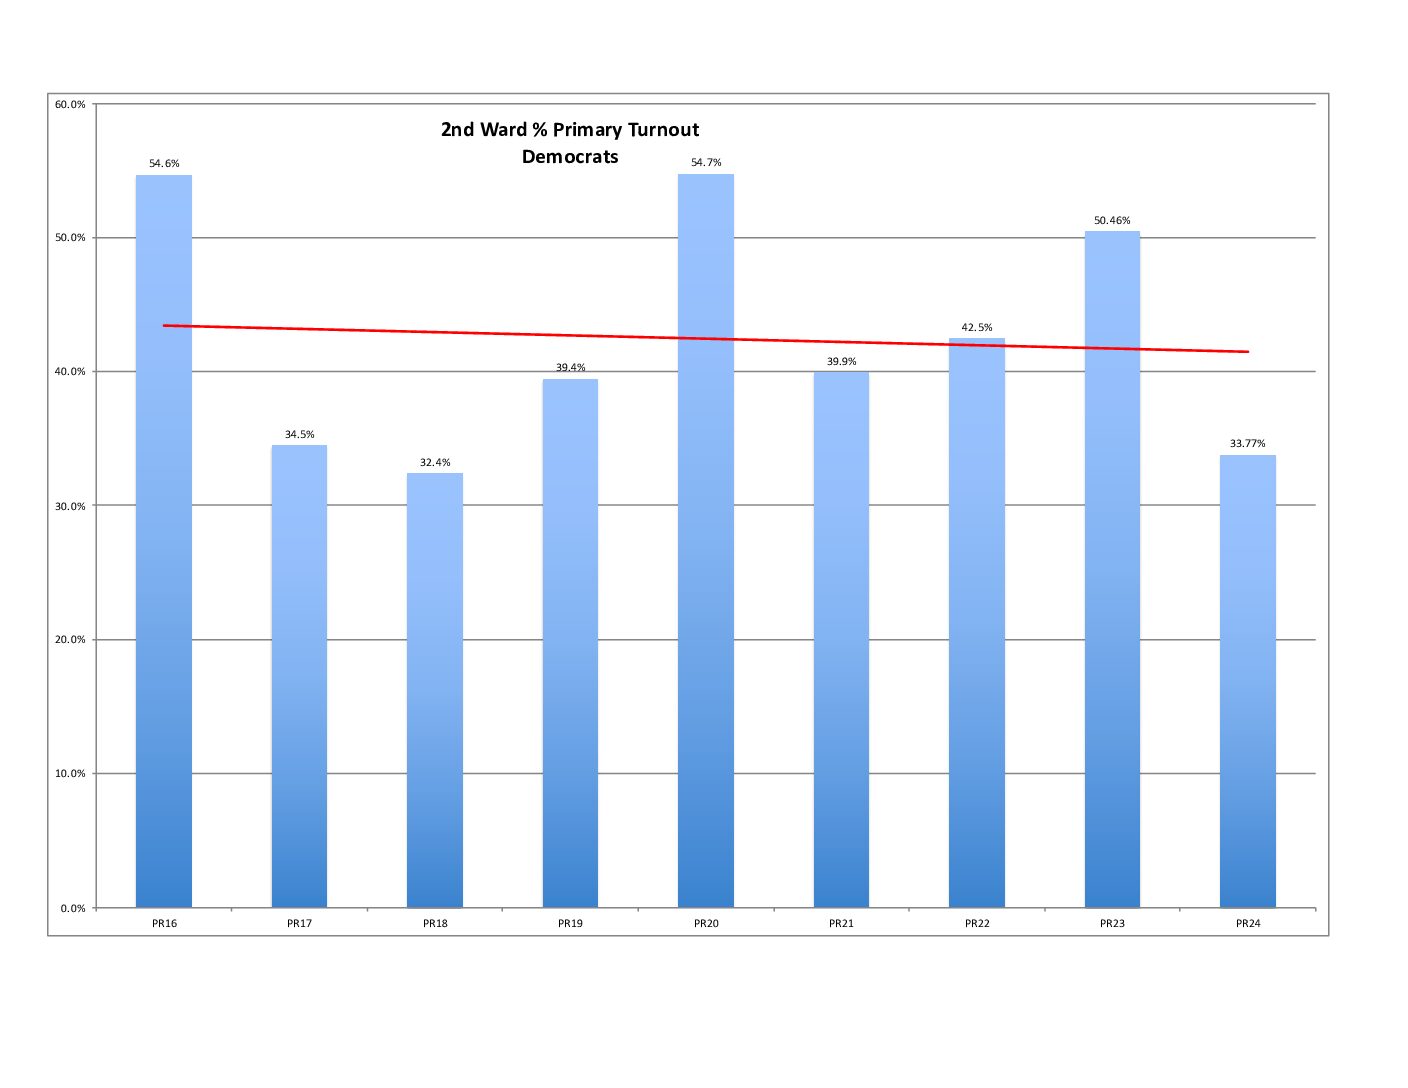
Unfortunately, we are in a downward trajectory for percent voter turnout. (The 2016 and 2020 Primaries show what we can do.)
Raw Turnout
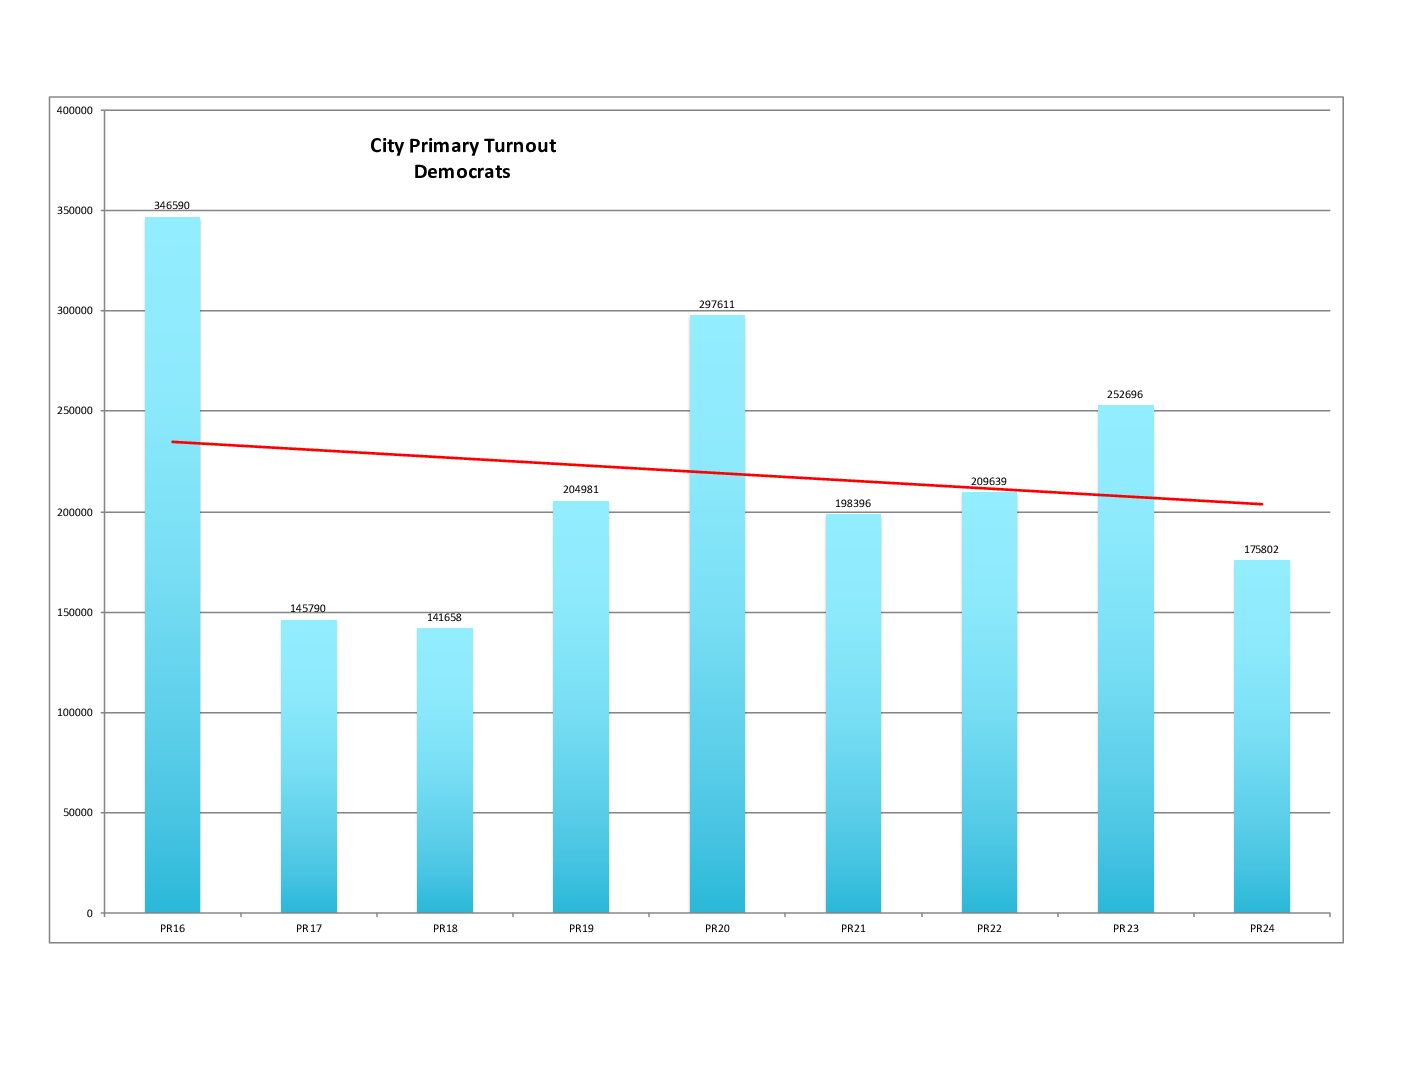
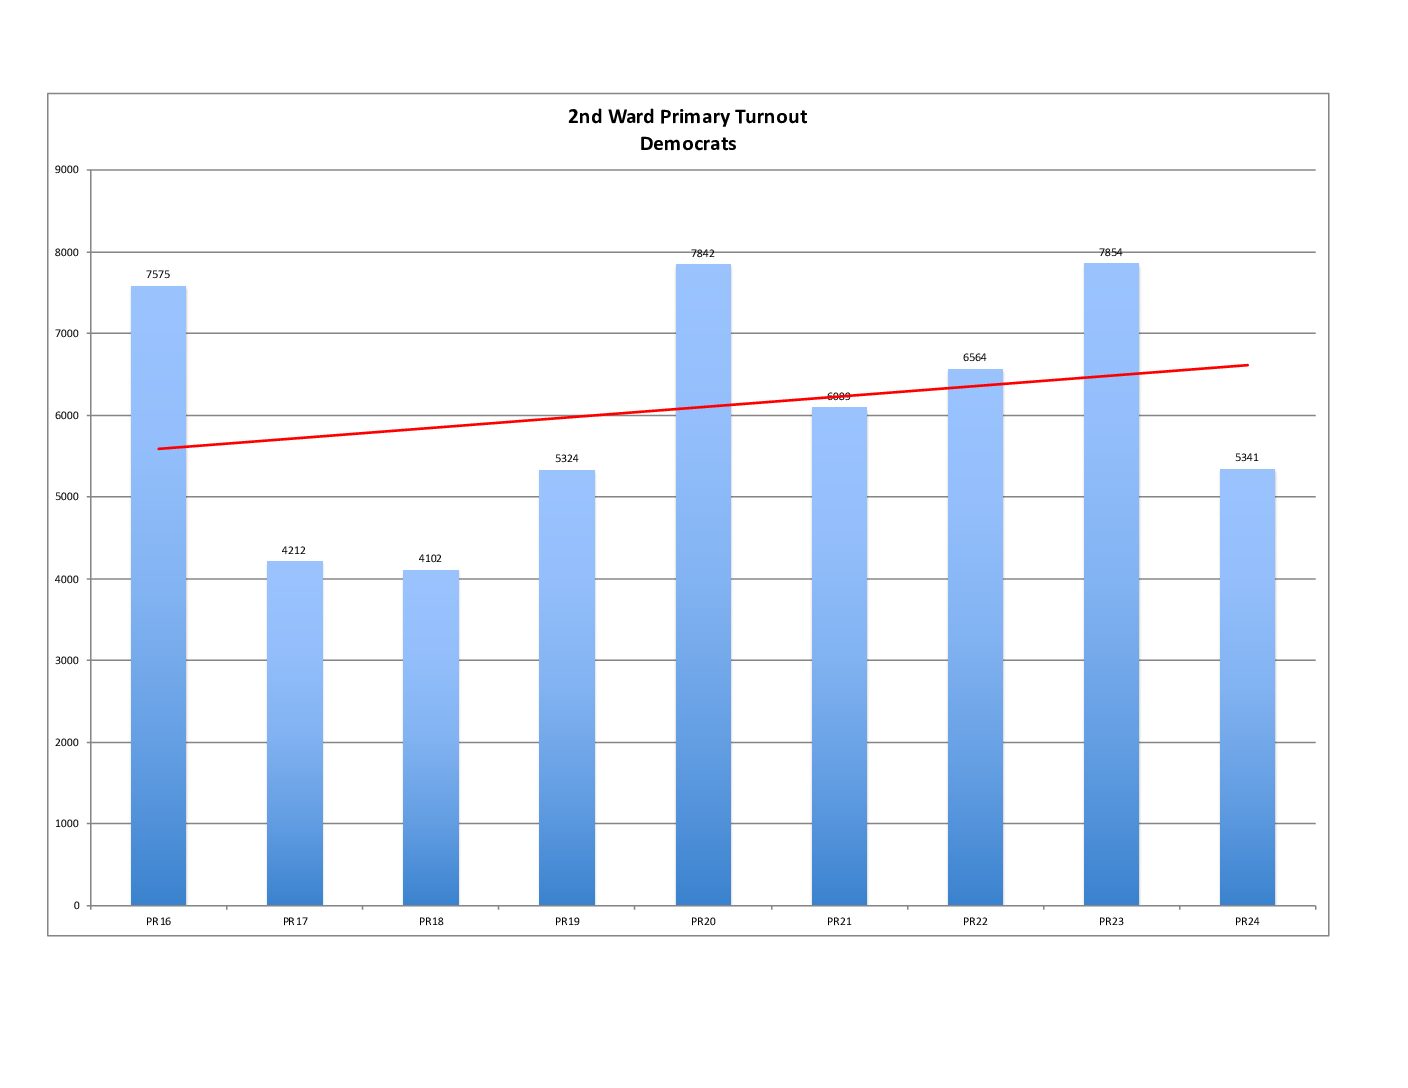
In terms of raw votes, the city is in a downward trajectory while the 2nd Ward is trending up. (Some good news for us.)
% and Raw Turnout Compared to Average of Primary Elections 2016 through 2023
% Turnout
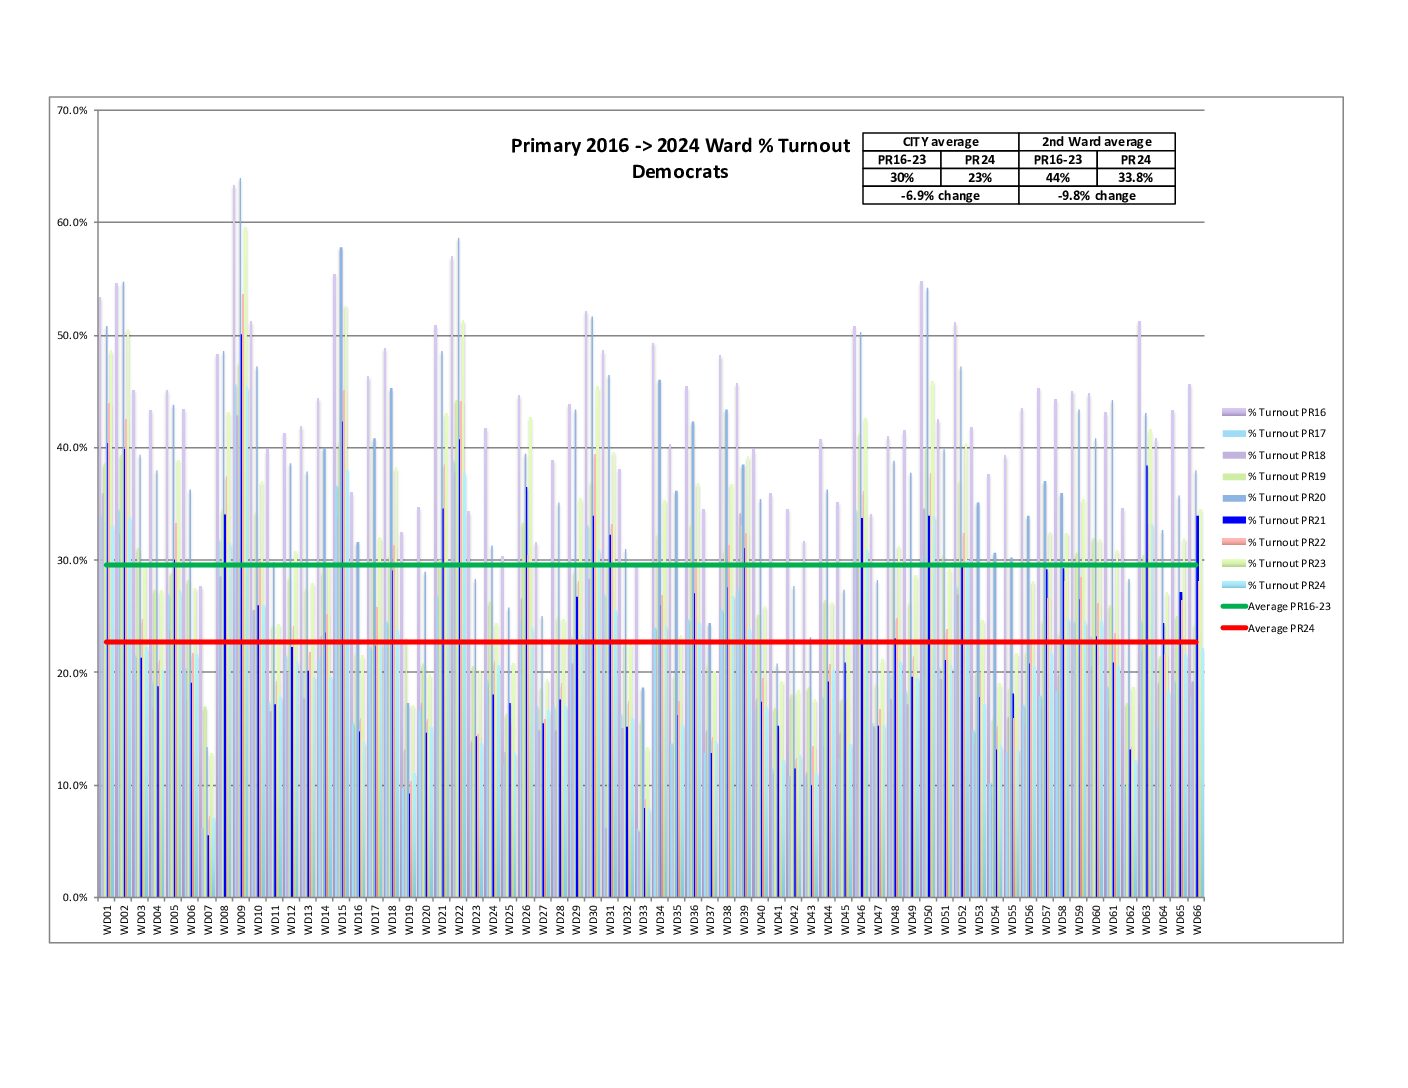
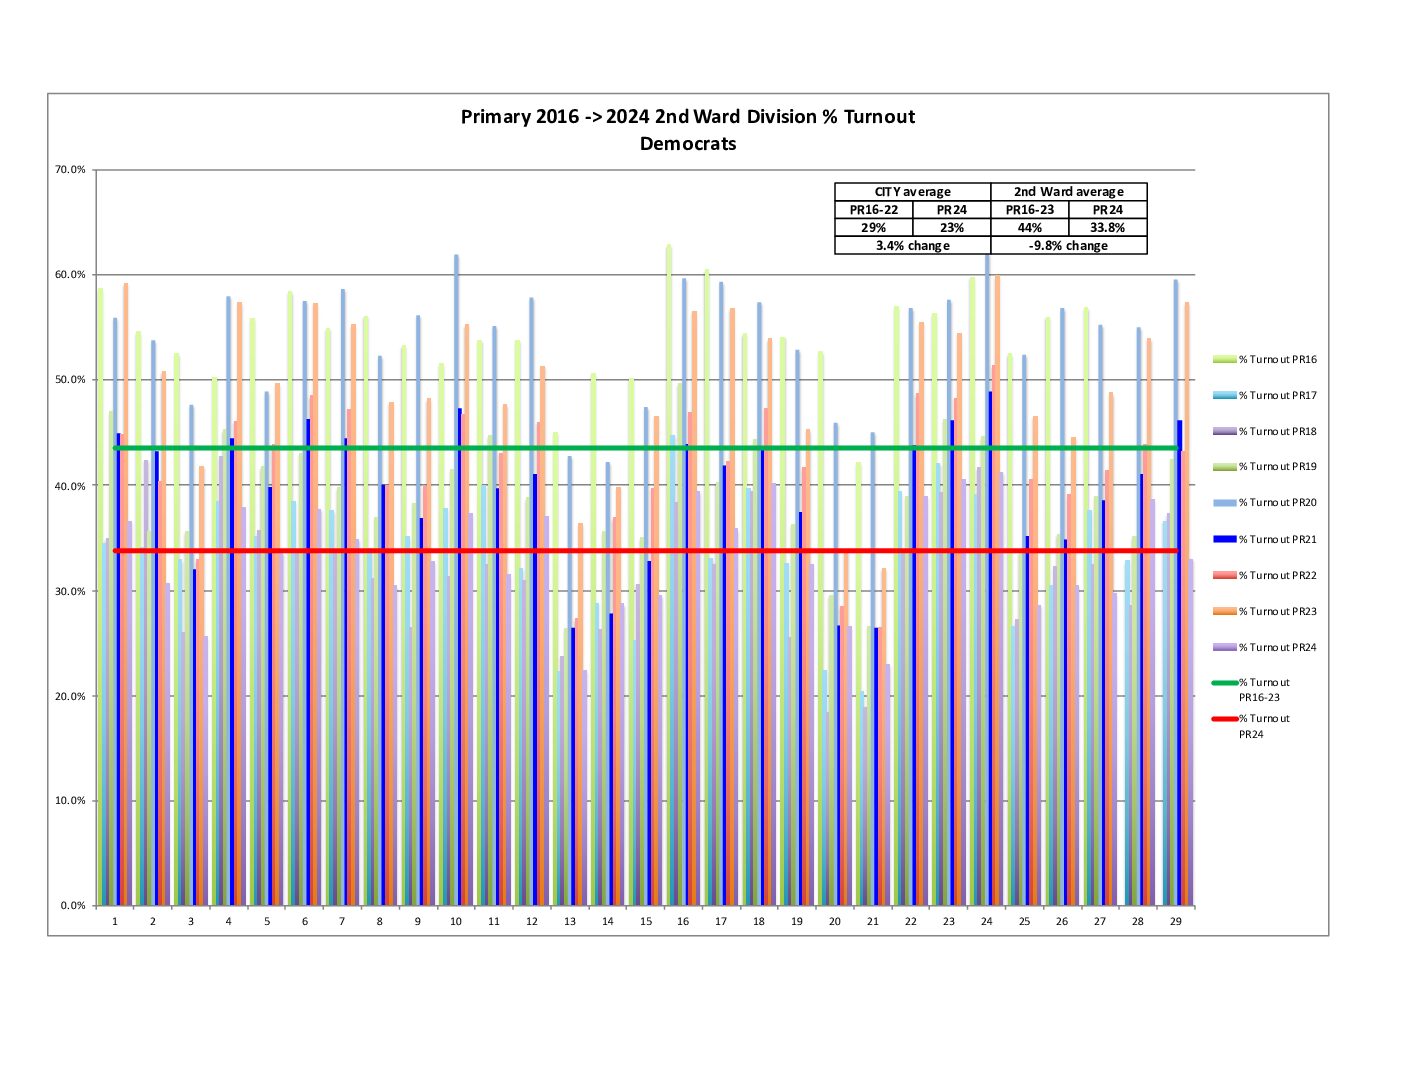
Both the city and 2nd Ward are showing a decrease in percent voter turnout compared to the average of 2016-2023 Primaries.
Raw Turnout

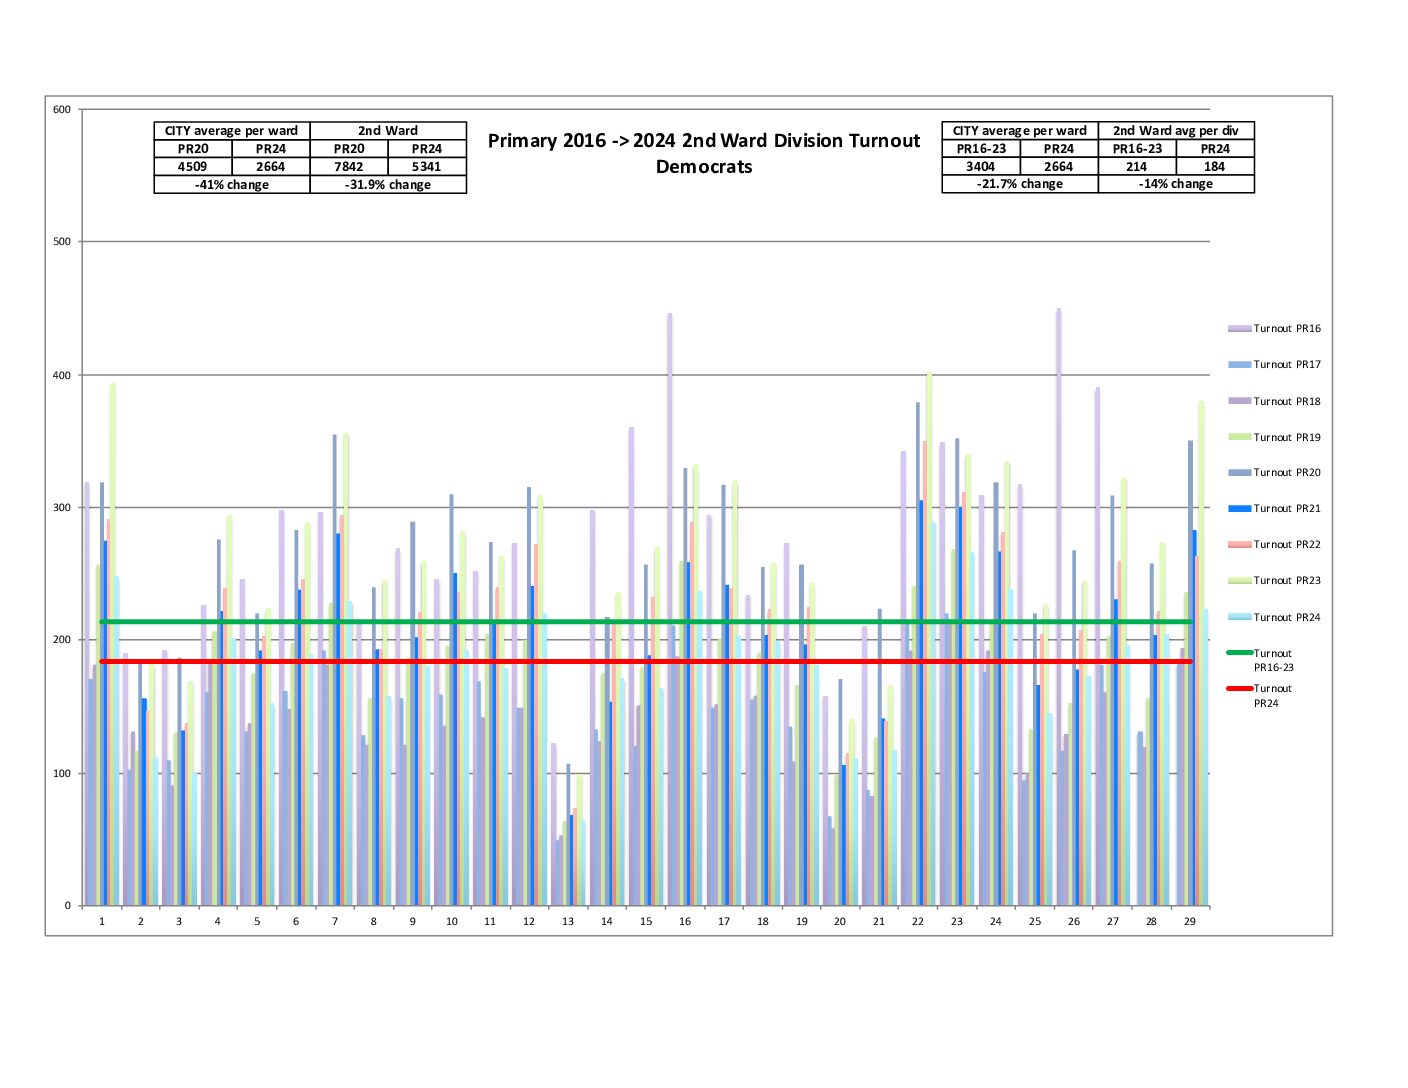
Also, both the city and 2nd Ward are showing a decrease in raw voter turnout compared to the average of 2016-2023 Primaries.
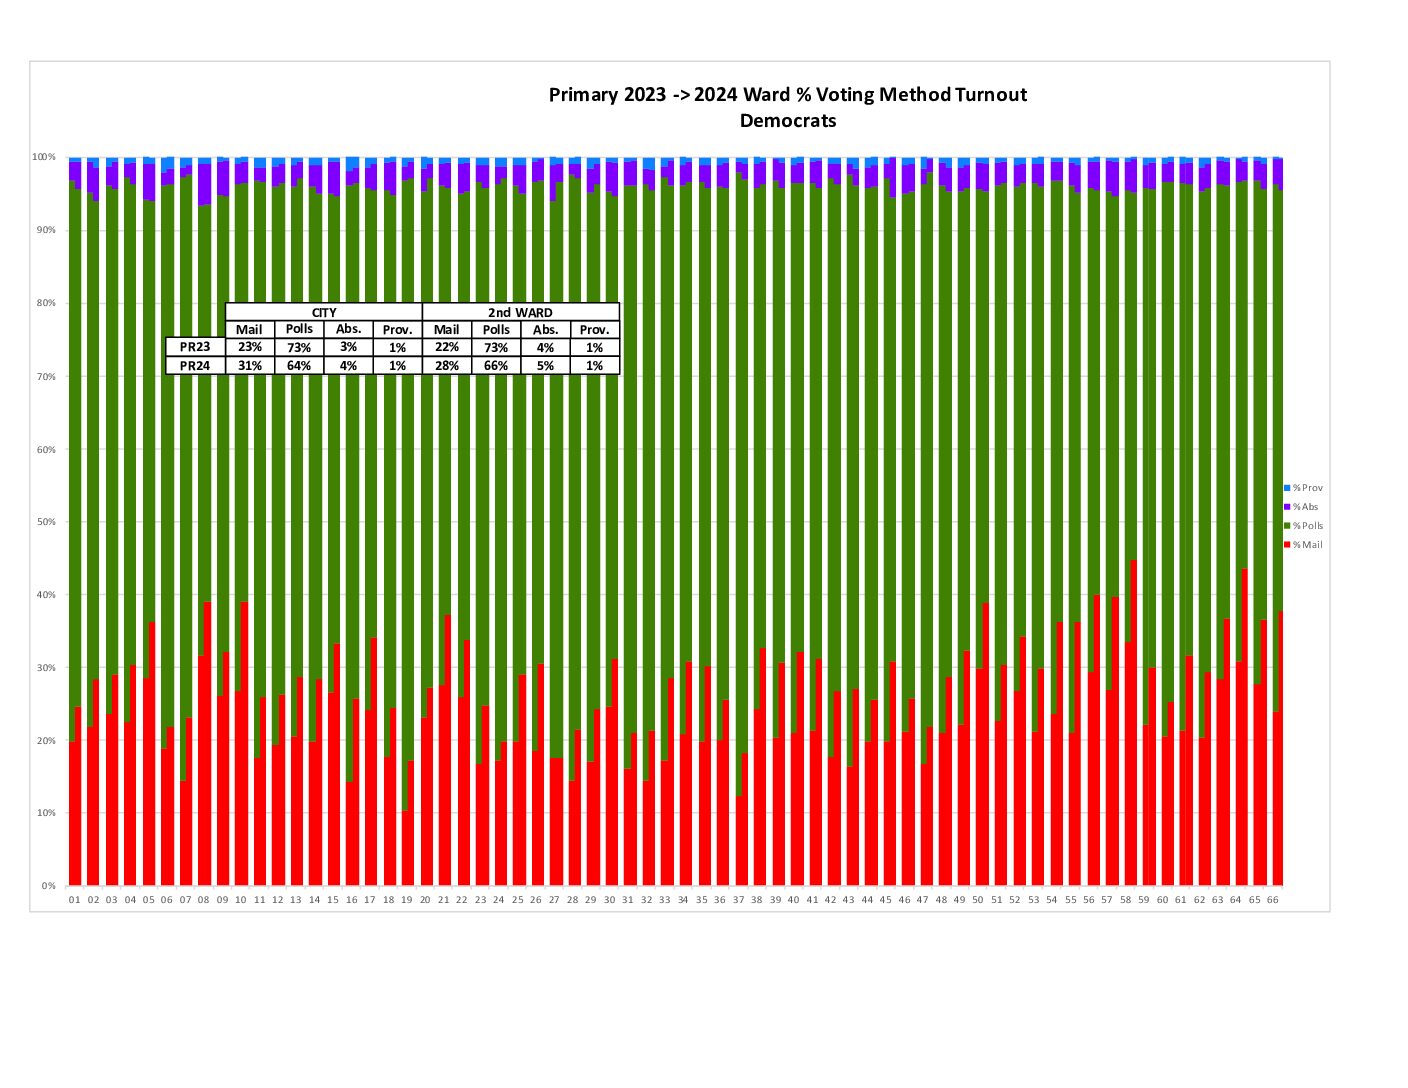
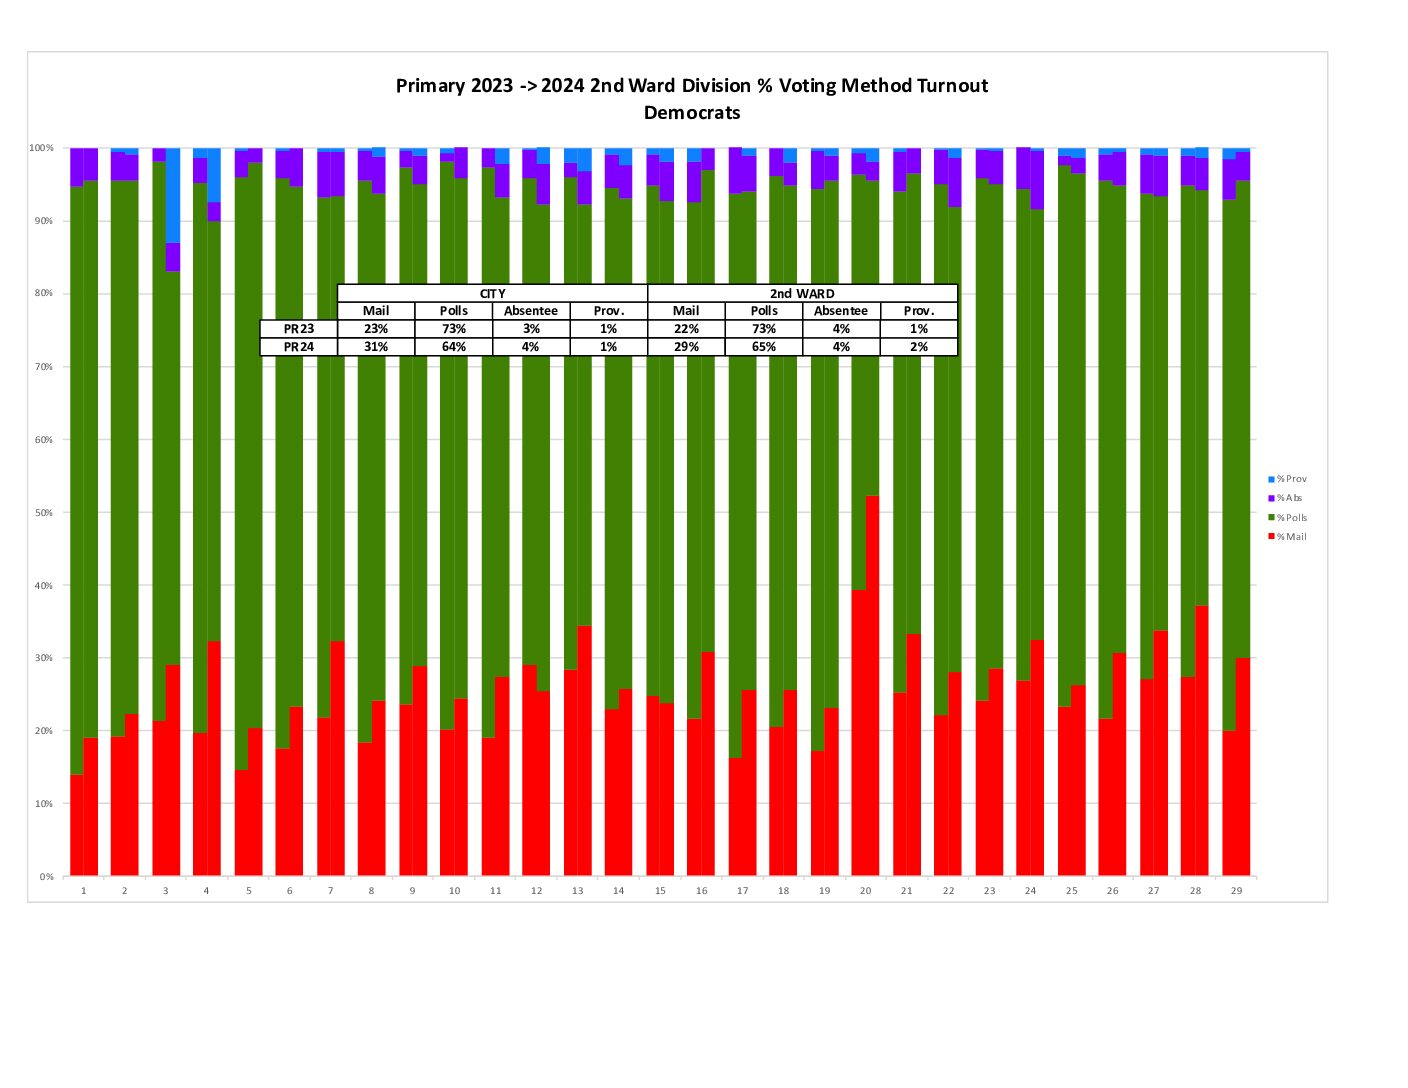
Turnout by Voting Method
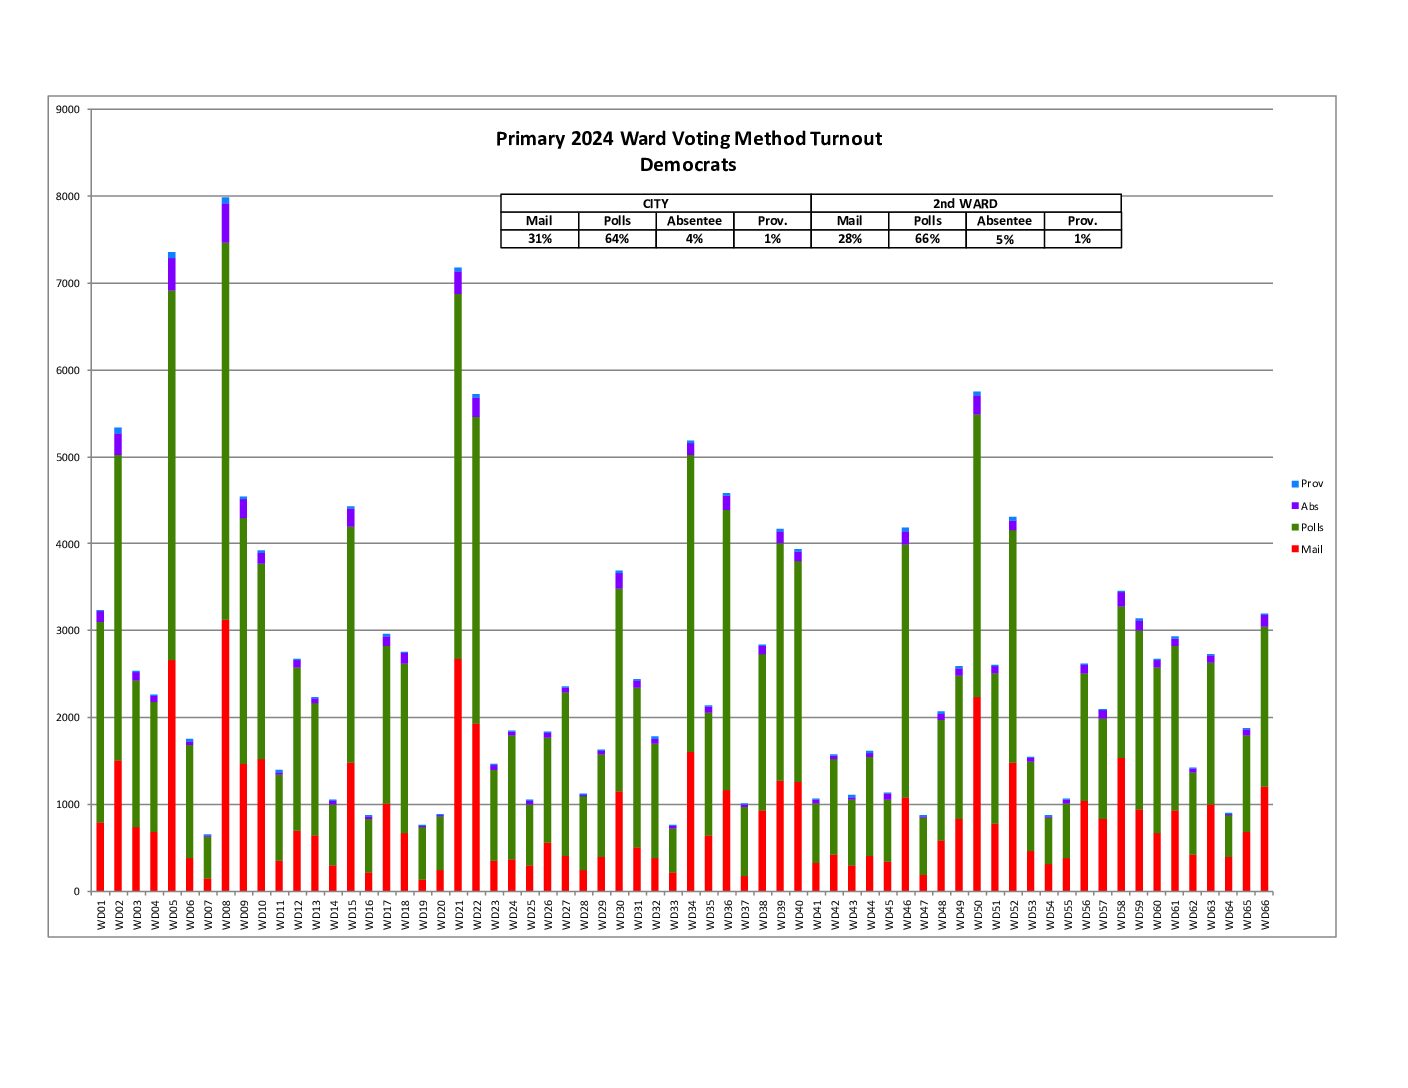
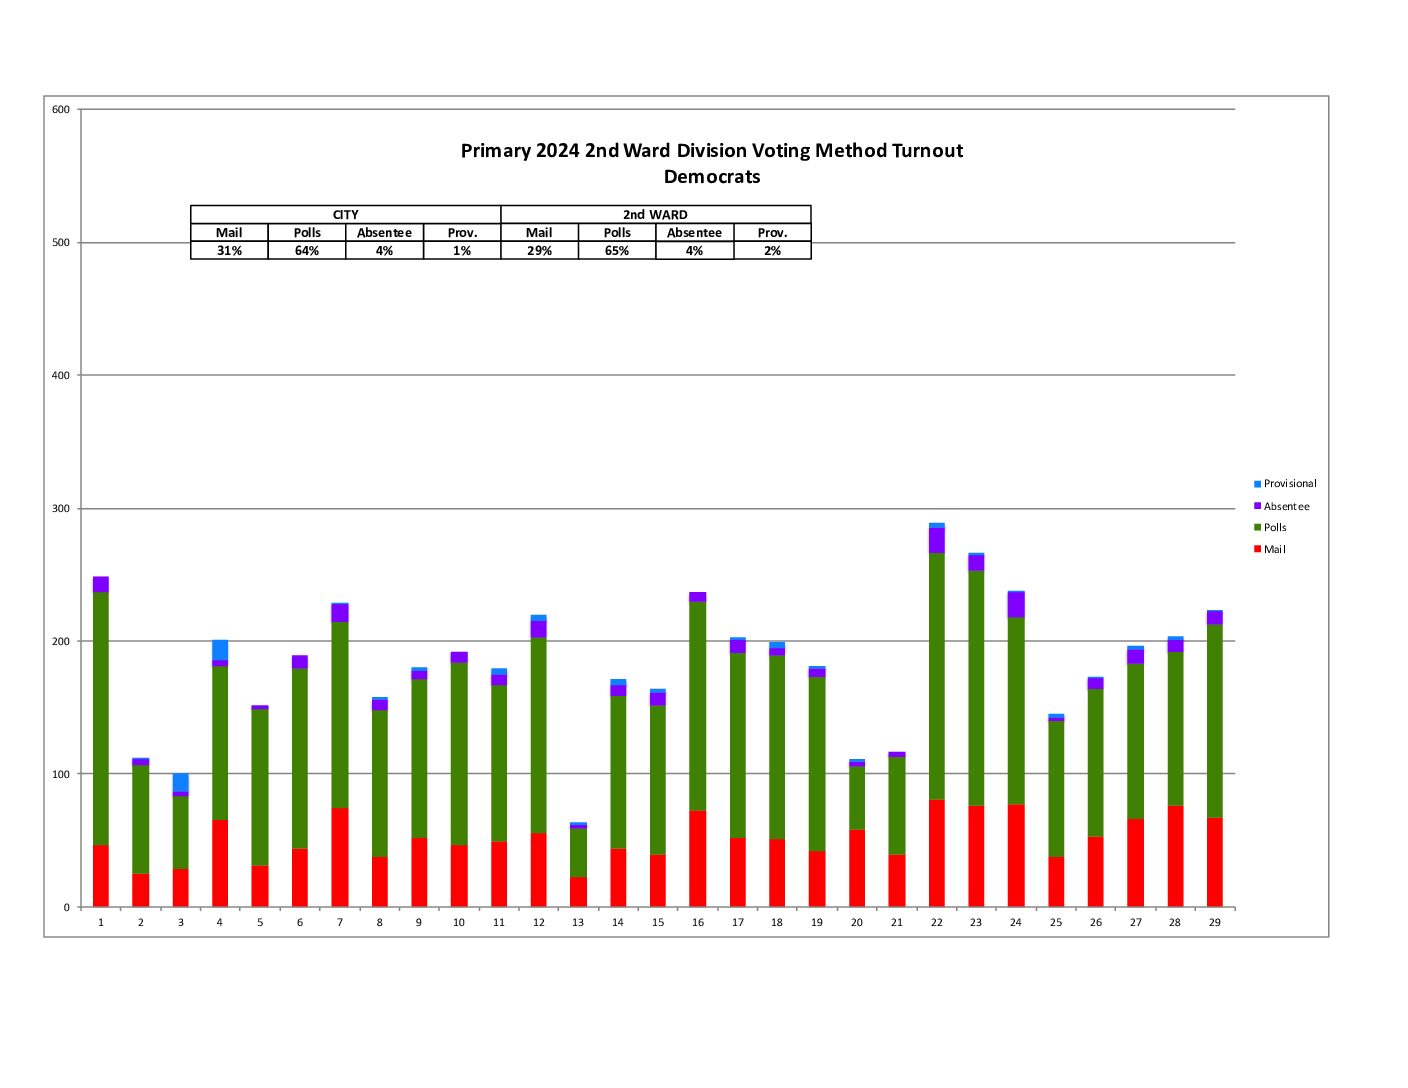
This shows the raw number of votes cast per ward broken into Mail, At Polls, Absentee, and Provisional. The 2nd Ward generally matched the city in terms of voting method.
Turnout by Voting Method comparison to last Primary
It looks like voting by mail is pretty stable.
% Voted Early
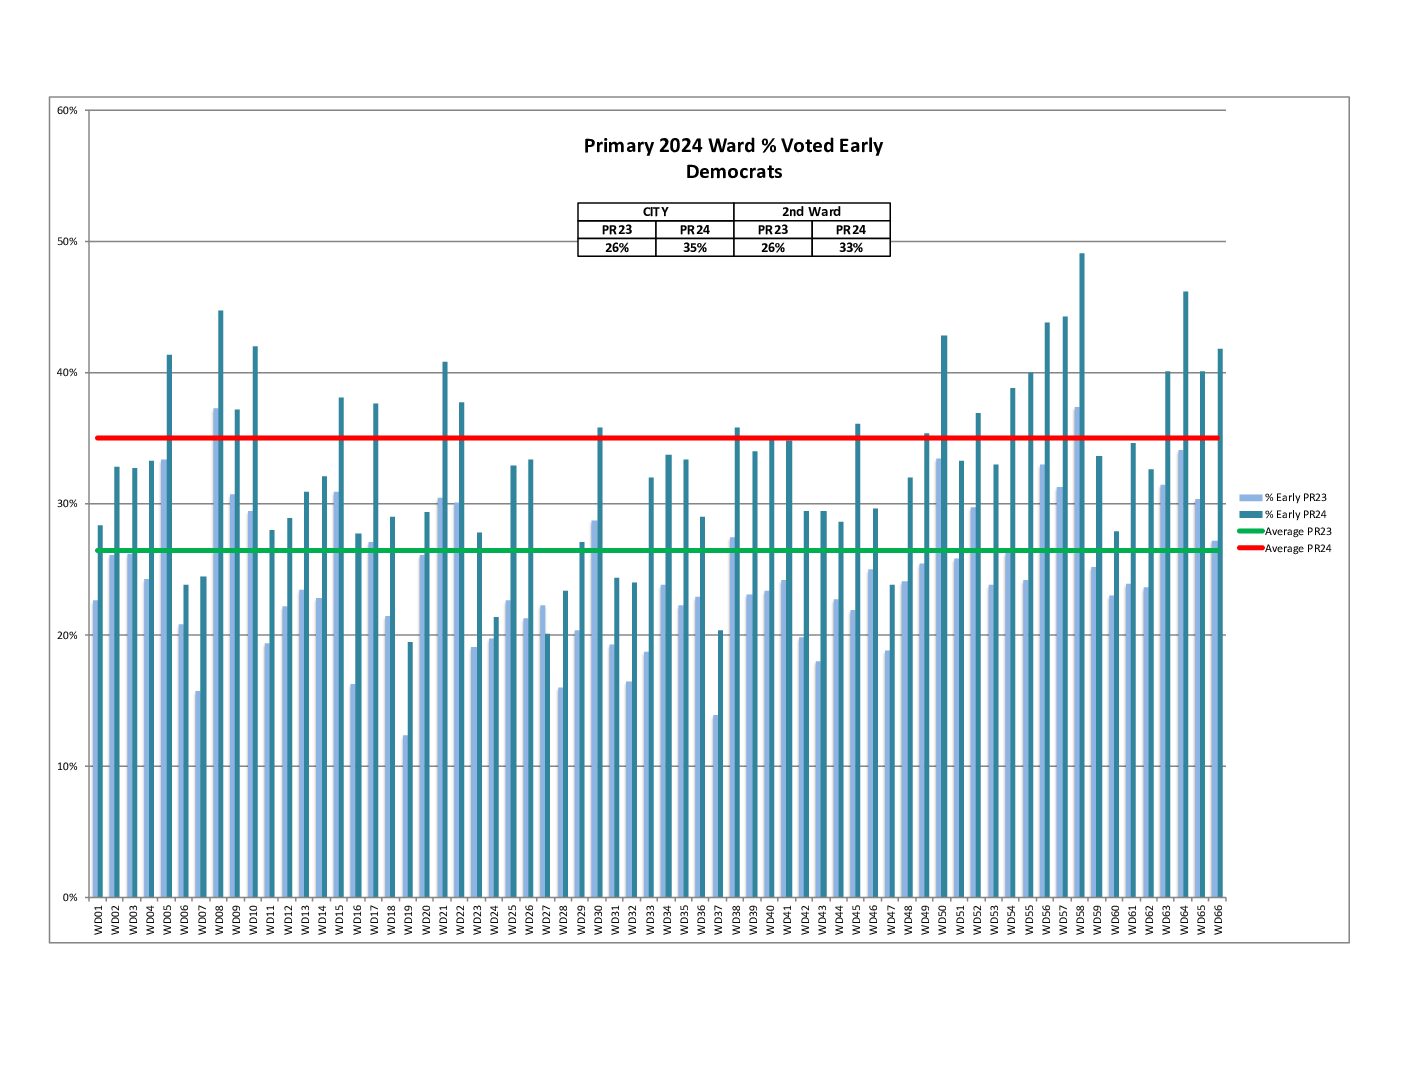
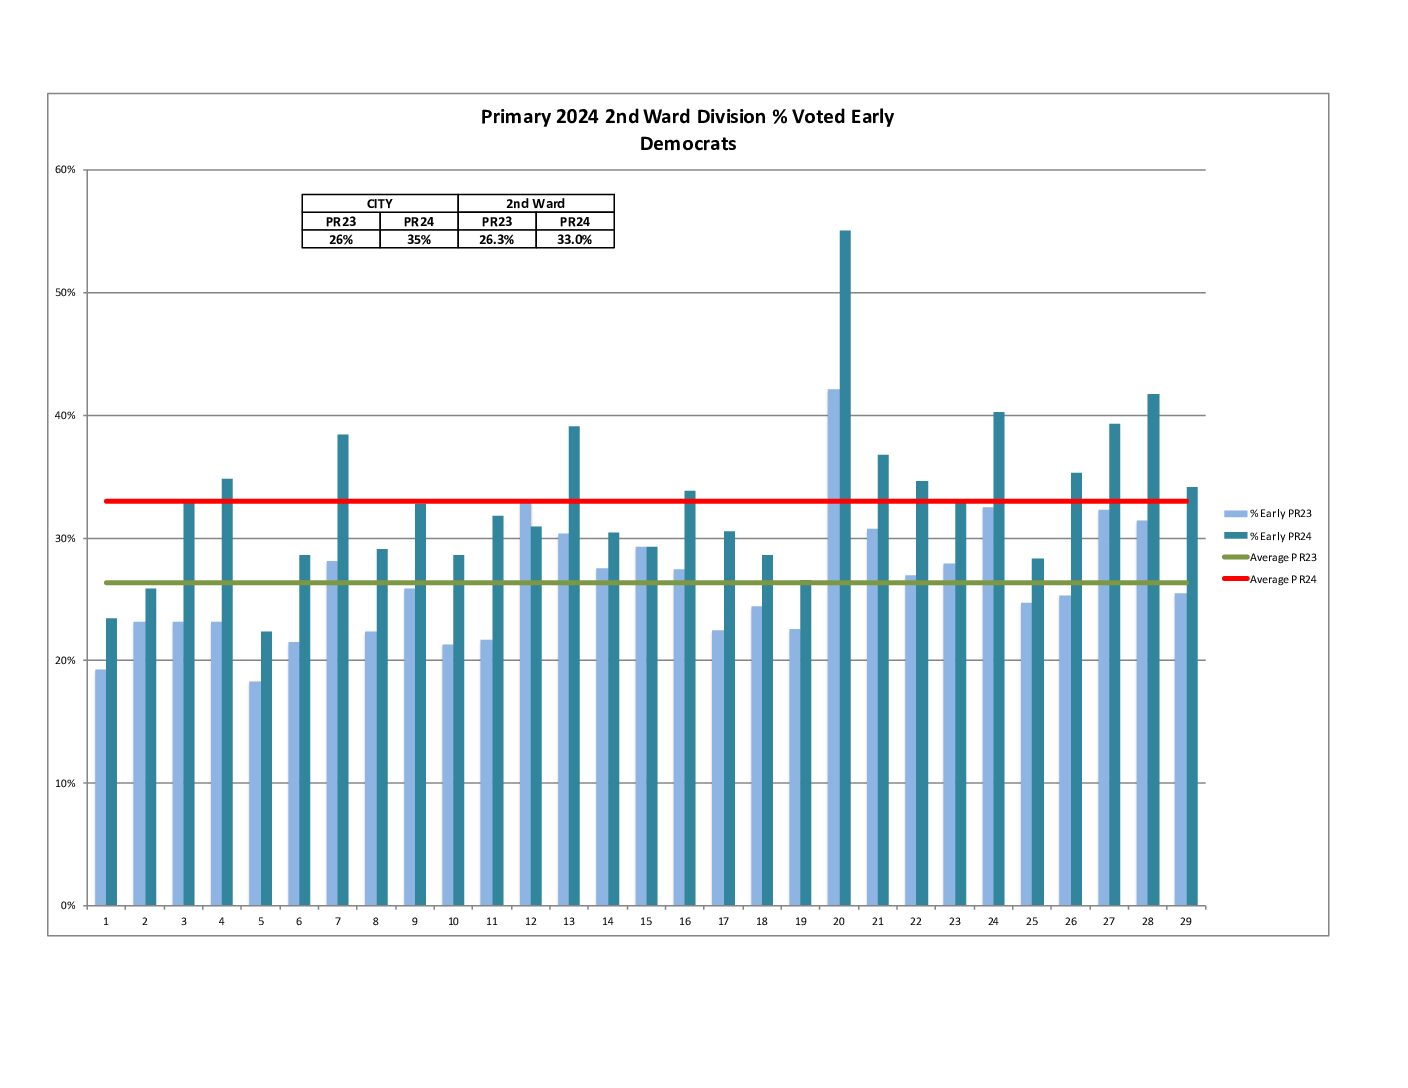
- Mail-in voting, Civilian overseas, Absentee
- Any voting method other than At Polls (AP)
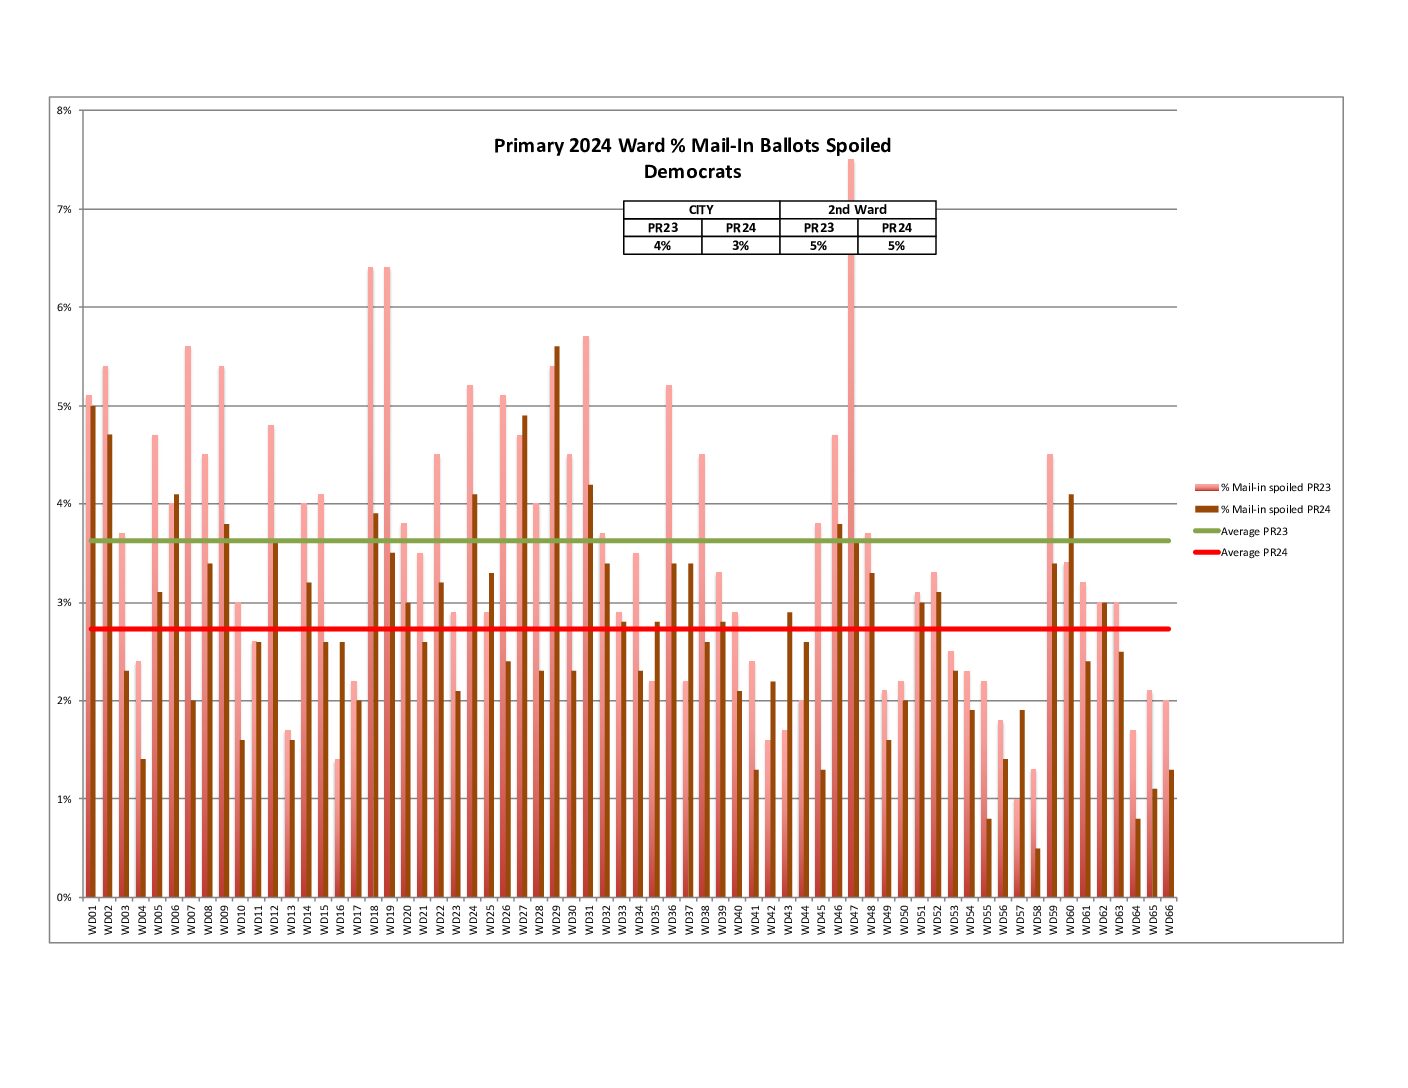
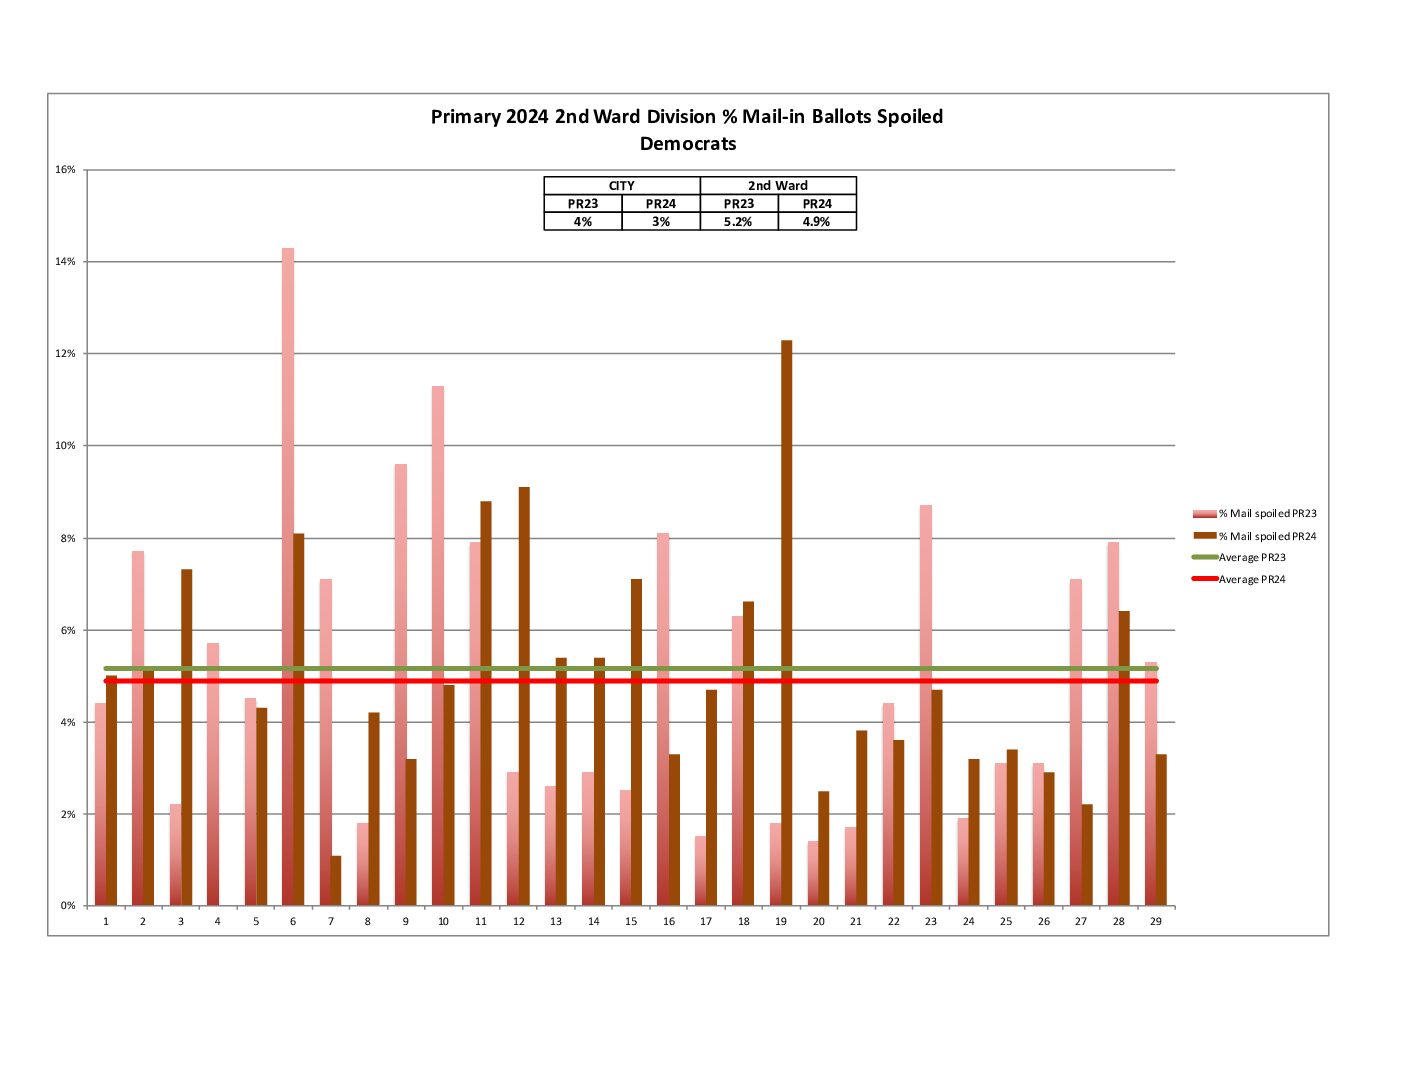
% Mail-in Ballots Spoiled
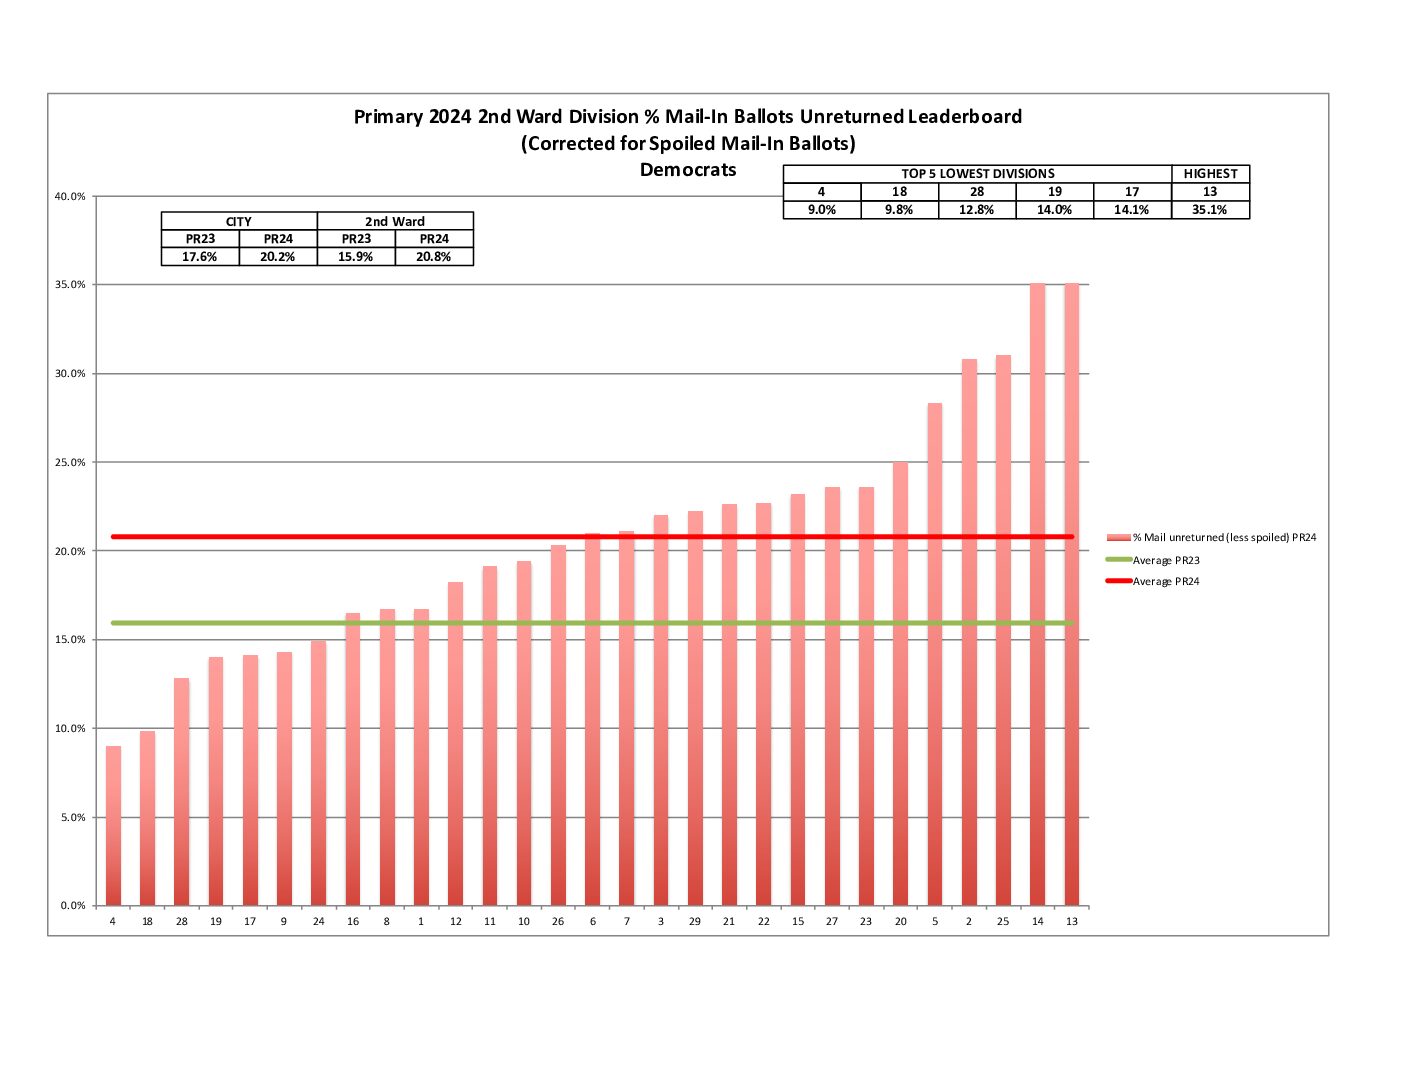
% Mail-in Ballots Unreturned
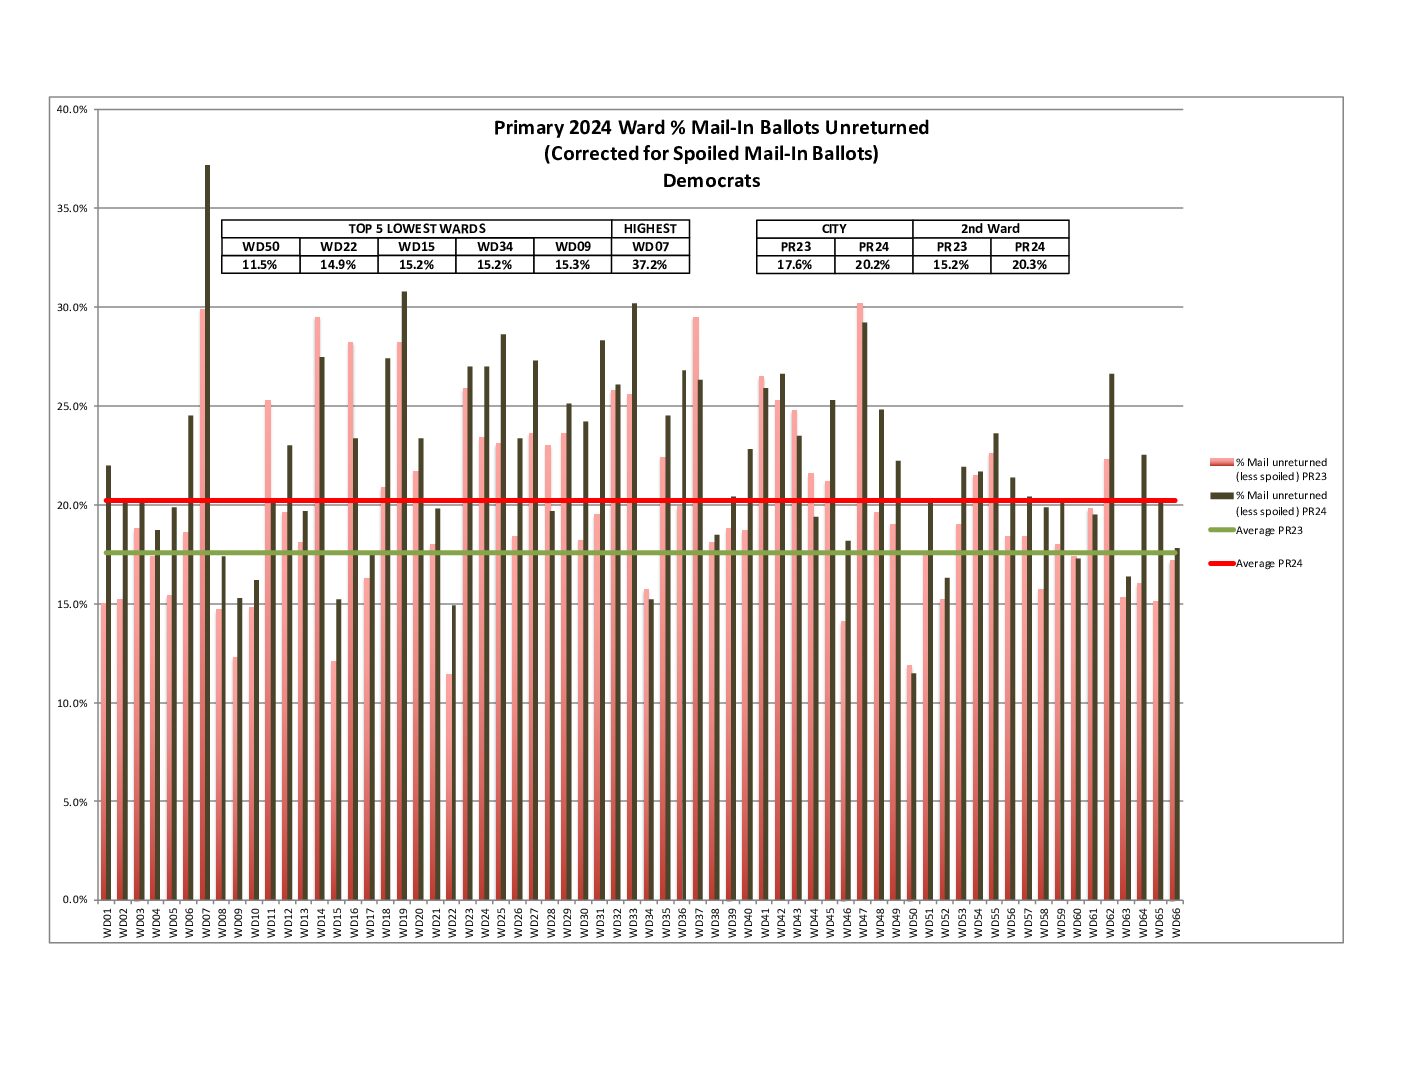
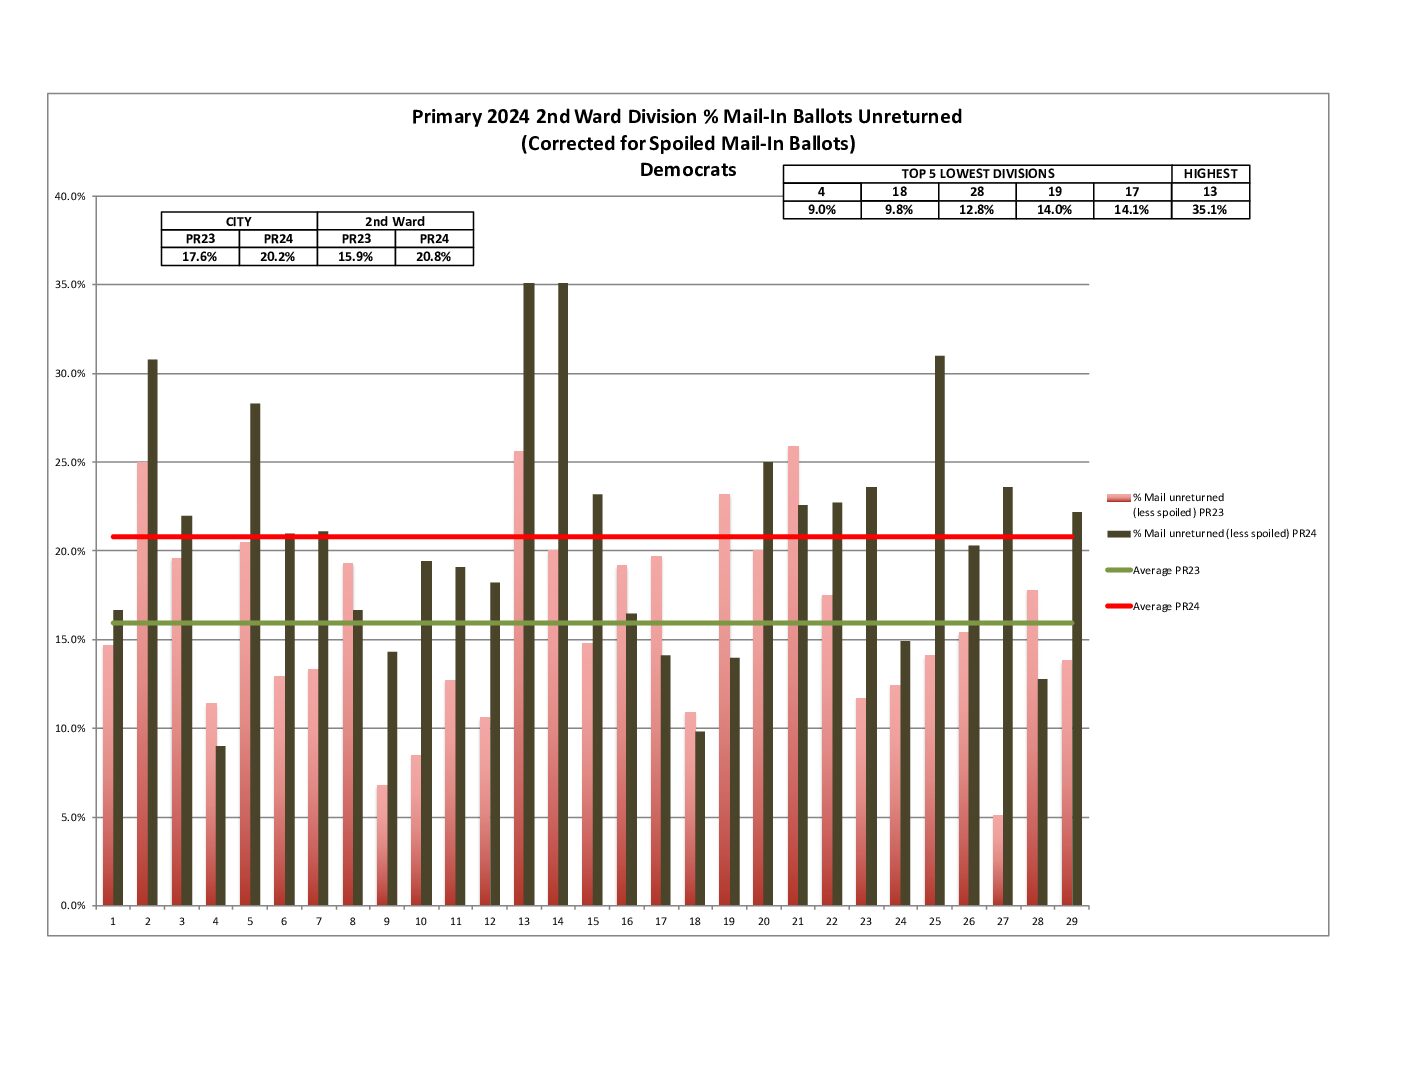
% Mail-in Ballots Unreturned Leaderboard
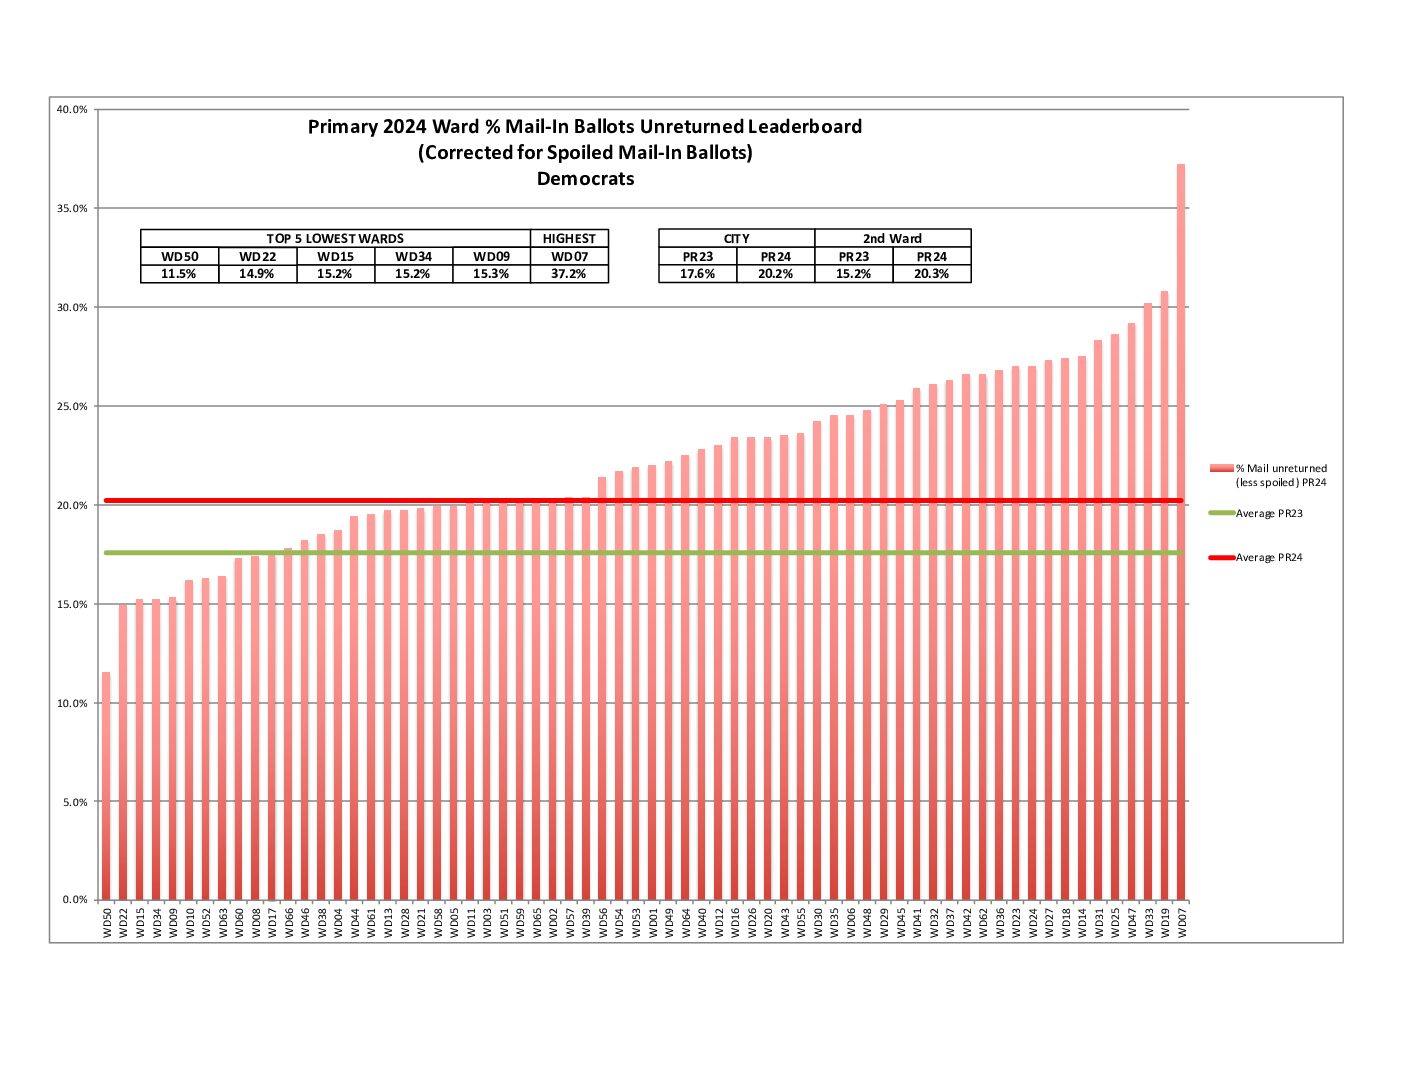
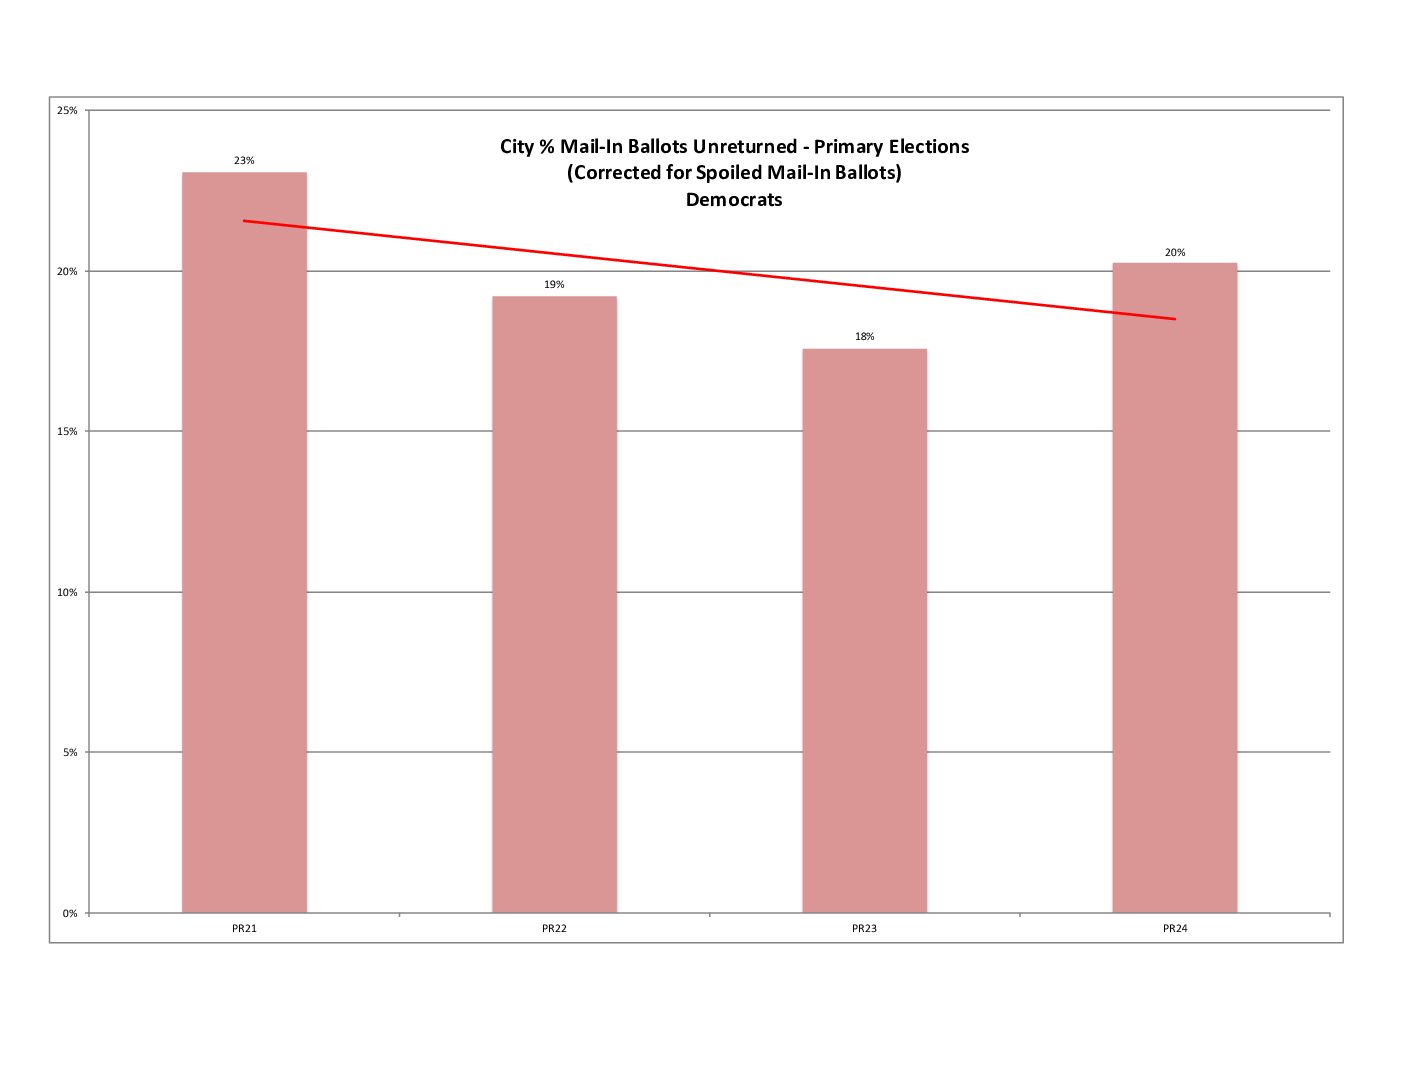
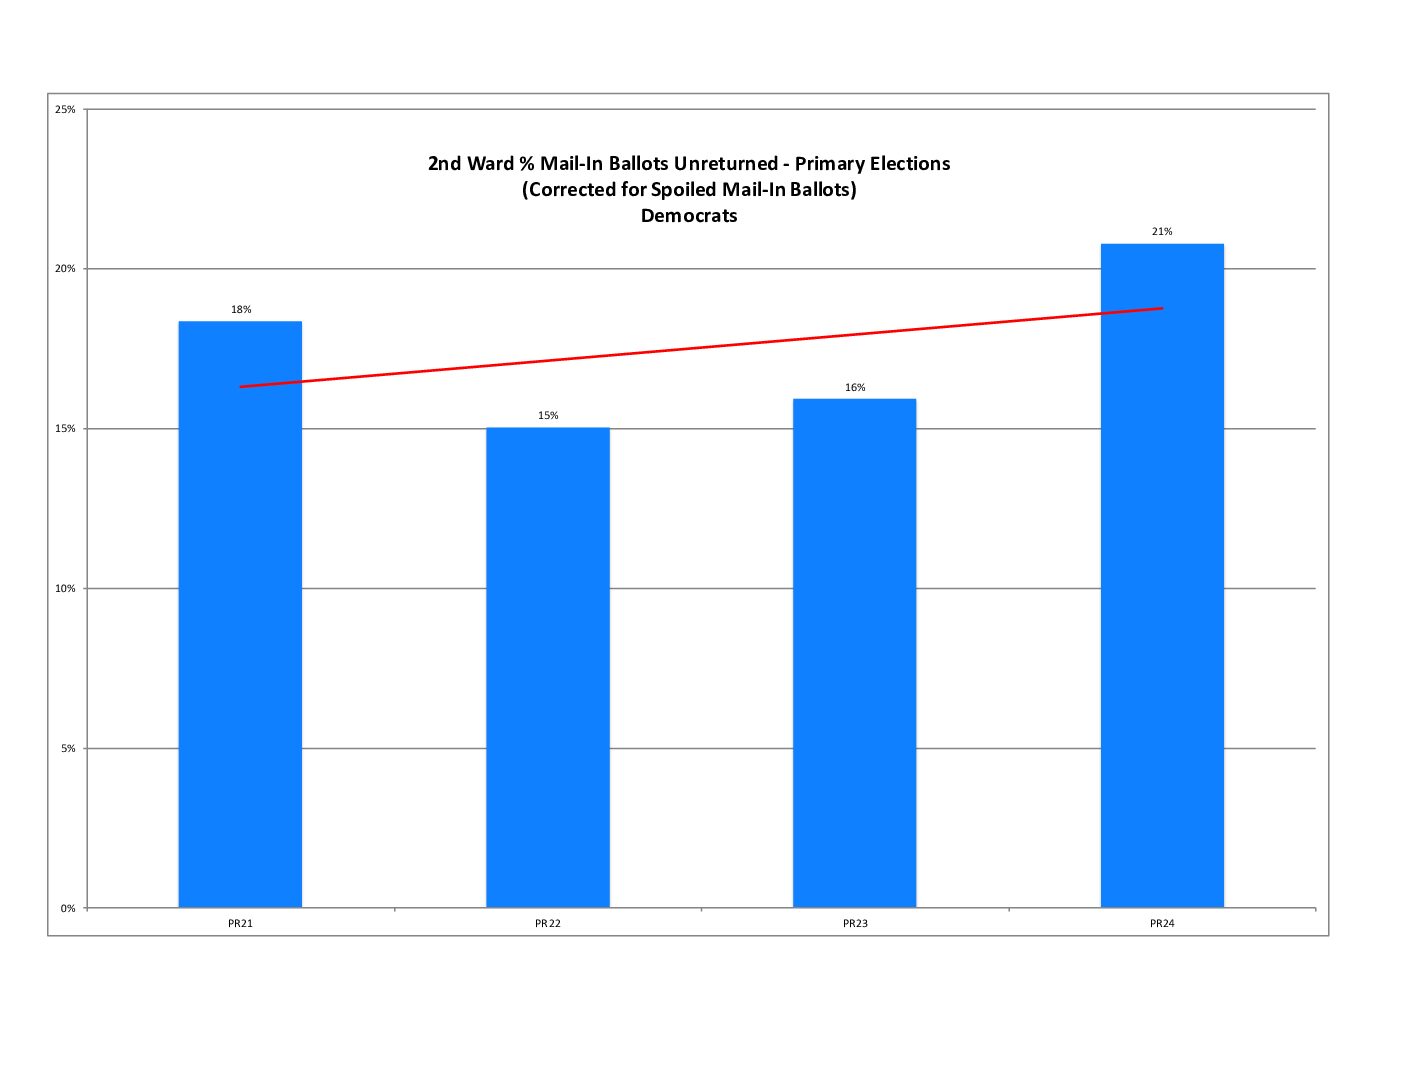
% Mail-in Ballots Unreturned History
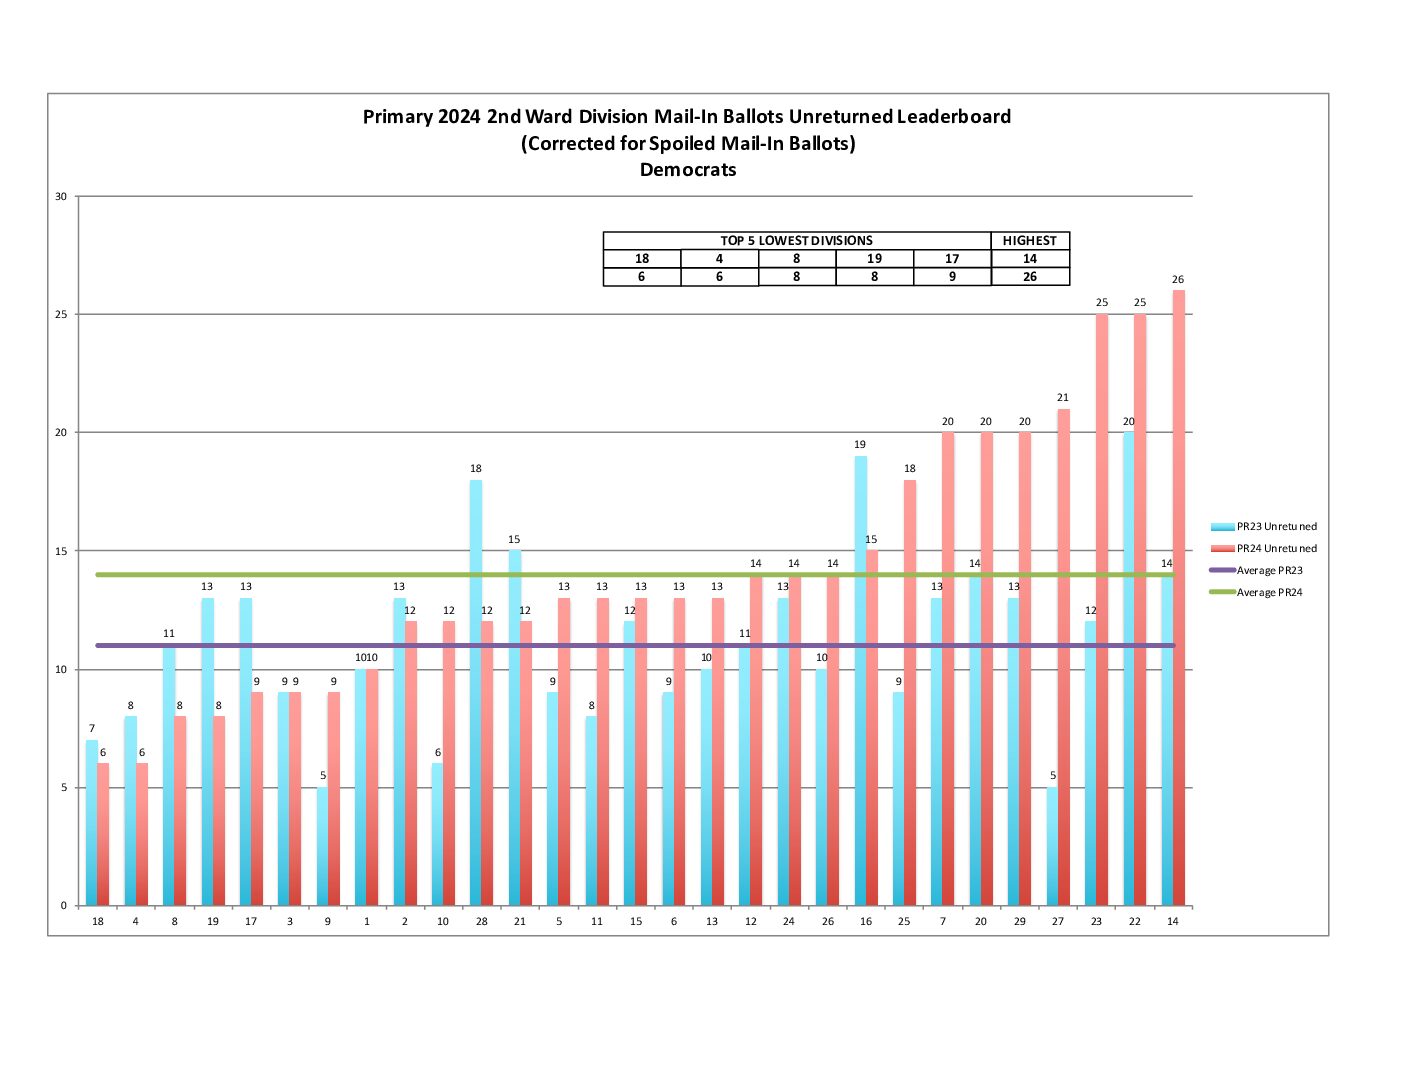
Mail-in Ballots Unreturned Leaderboard
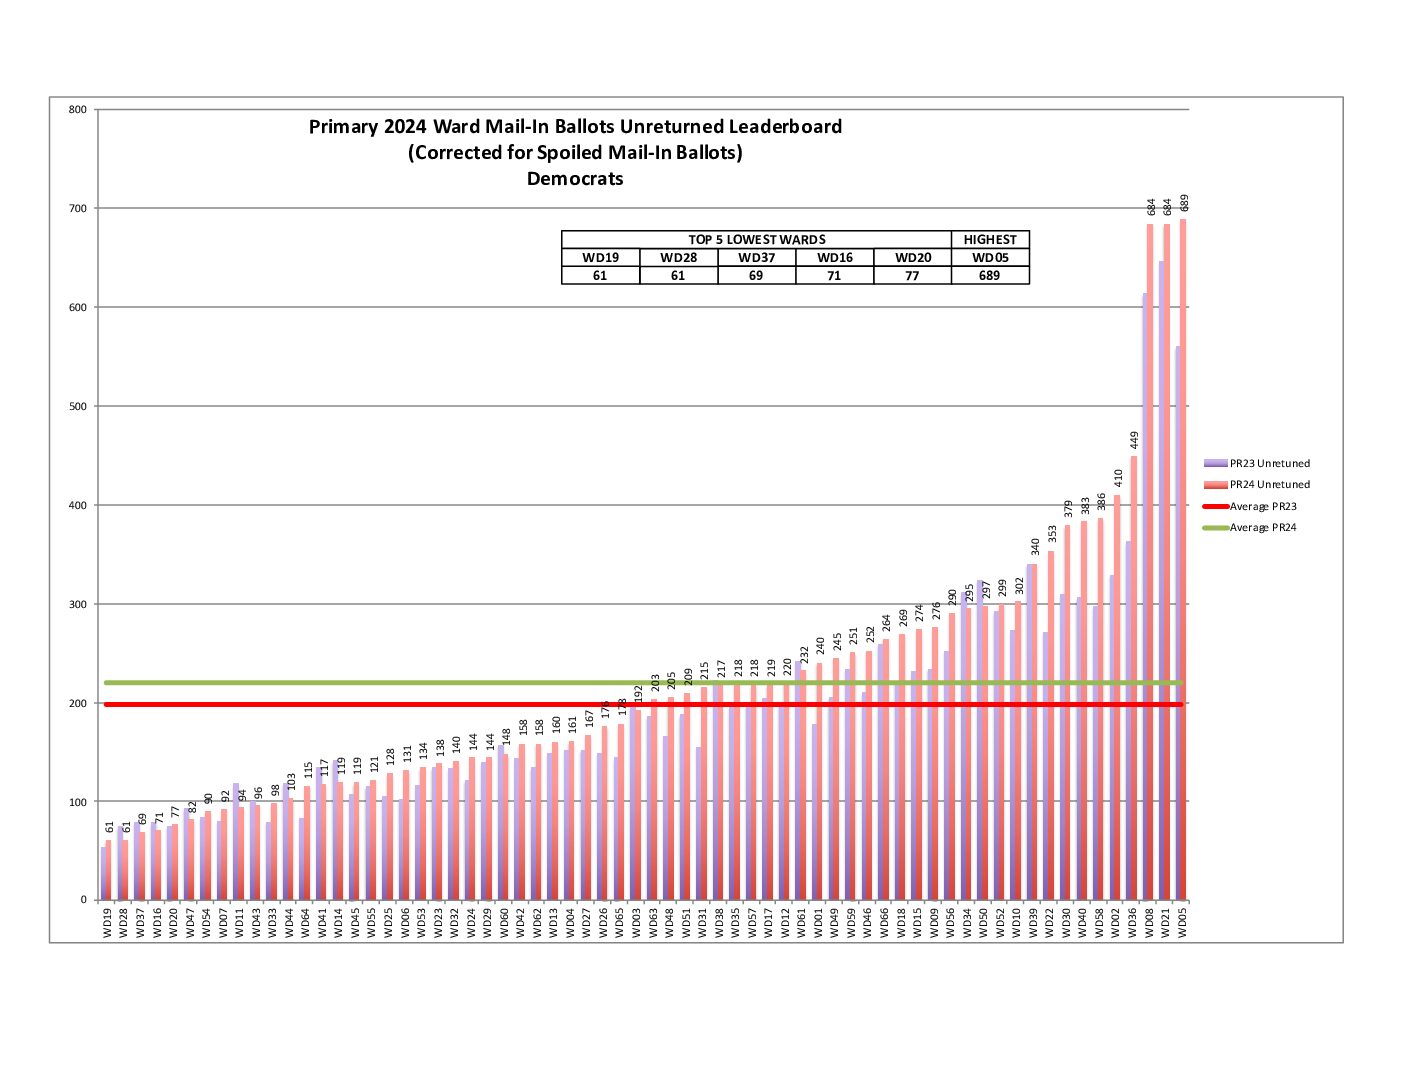
PSA: Don’t be one of these unreturned ballots! Never mail your ballot within one week of the election as it may not arrive in time. It must be RECEIVED by 8 PM on Election Day.
If you still have your ballot within one week of the election, always use a drop box – or bring your ballot to the polls. It will be spoiled (cancelled) and you will be allowed to vote on the machines.
If your ballot was not received by Election Day, or you don’t think you mailed it in time, come to the polls and vote provisionally. That way, your vote will count no matter what.
% Change in Turnout from Last Primary

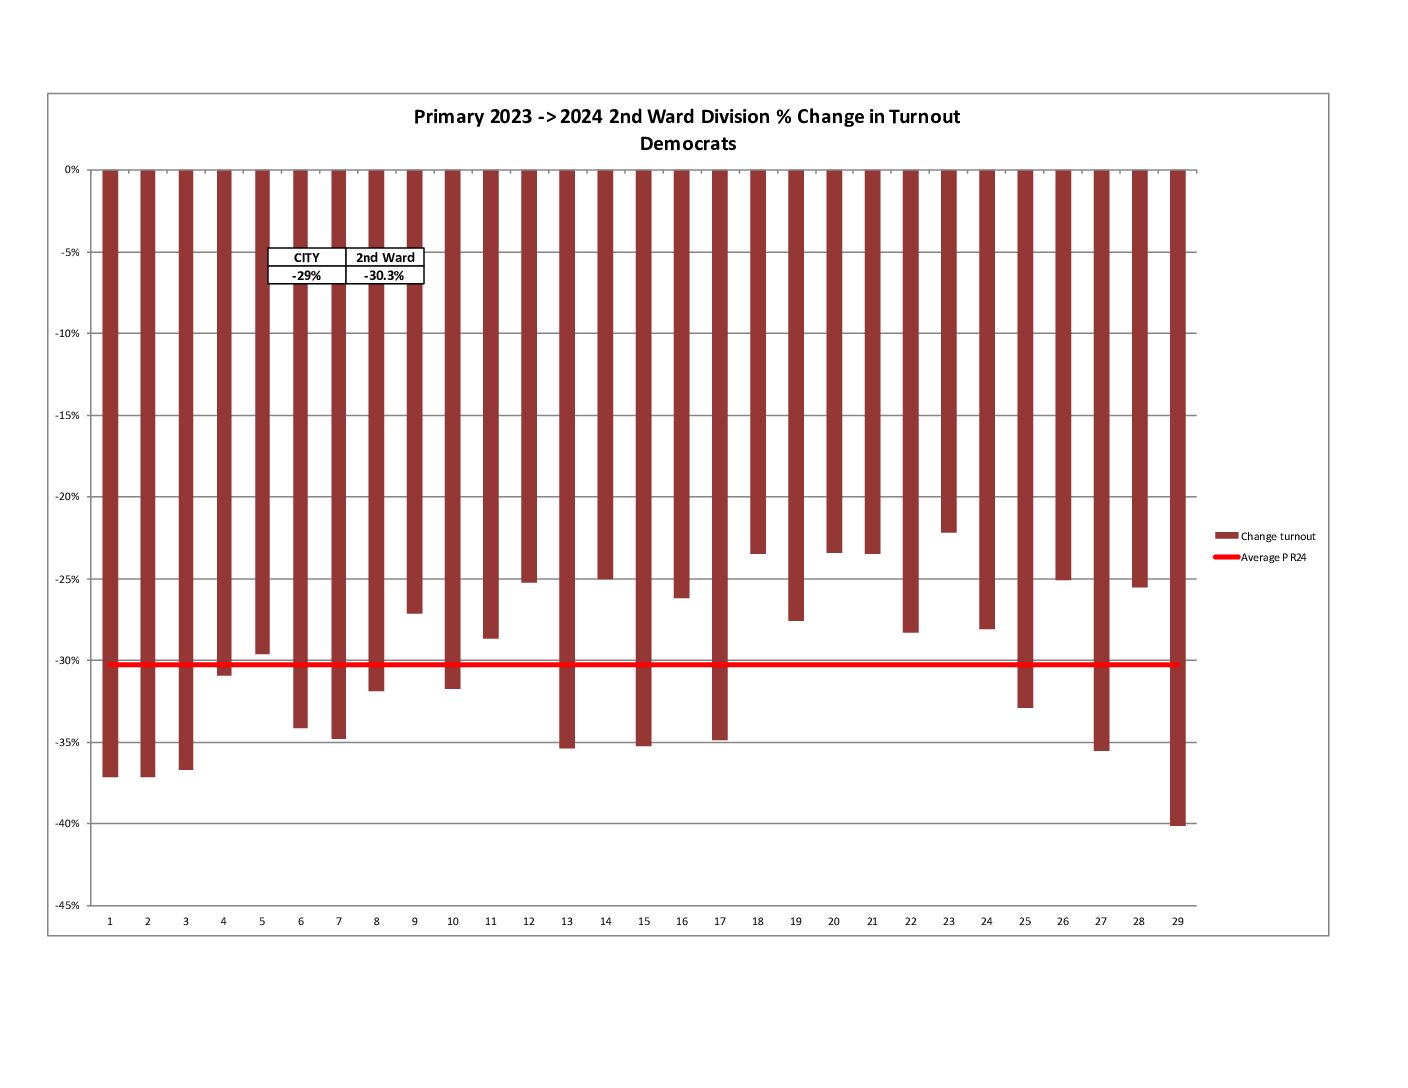
If we look at percent change in turnout between the primary elections of 2022 and 2023, voter turnout was down 30%.
Endorsements
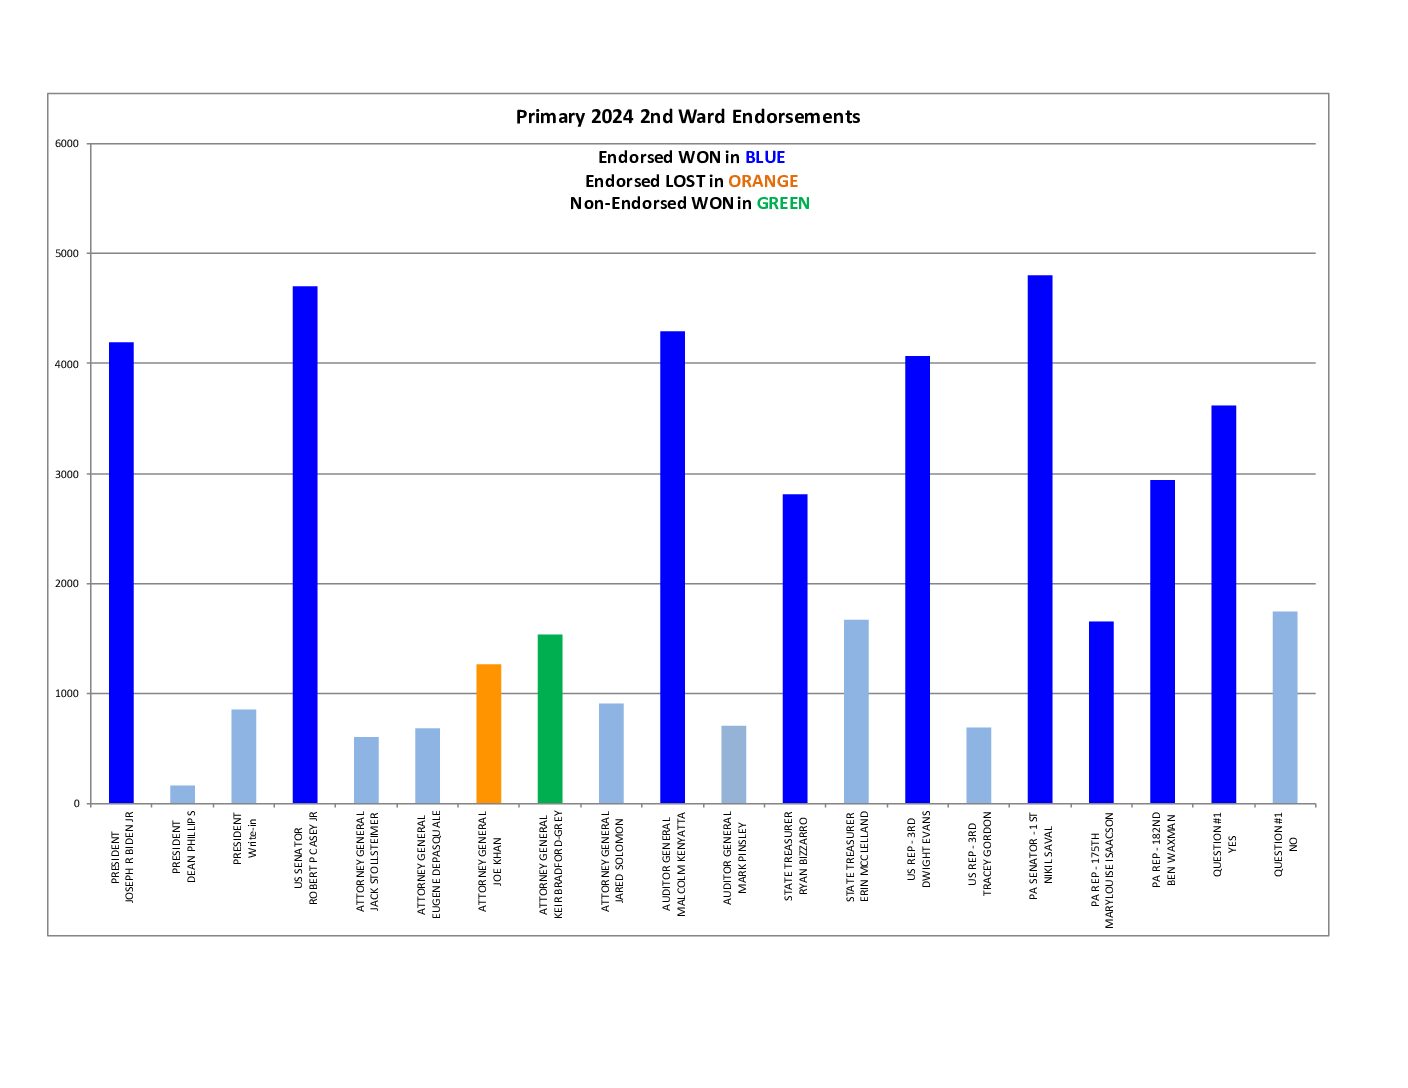
Here’s the outcome of our endorsed candidates (with city and state results, if different):
- US President/Vice President: Joe Biden/Kamala Harris, of course
- US Senate: Bob Casey; US House District 3: Dwight Evans
- PA Attorney General: We did not carry our endorsed candidate Joe Khan. Keir Bradford-Grey won the ward and city, but Eugene DePasquale prevailed statewide.
- PA Auditor General: Malcolm Kenyatta
- PA Treasurer: Endorsed Ryan Bizzarro won our ward and city – but Erin McClelland bested him statewide.
- PA Senate District 1: Nikil Saval; PA House District 182: Ben Waxman
- Ballot question: Protections for RCOs from SLAPP lawsuits won for YES (endorsed).
Attorney General
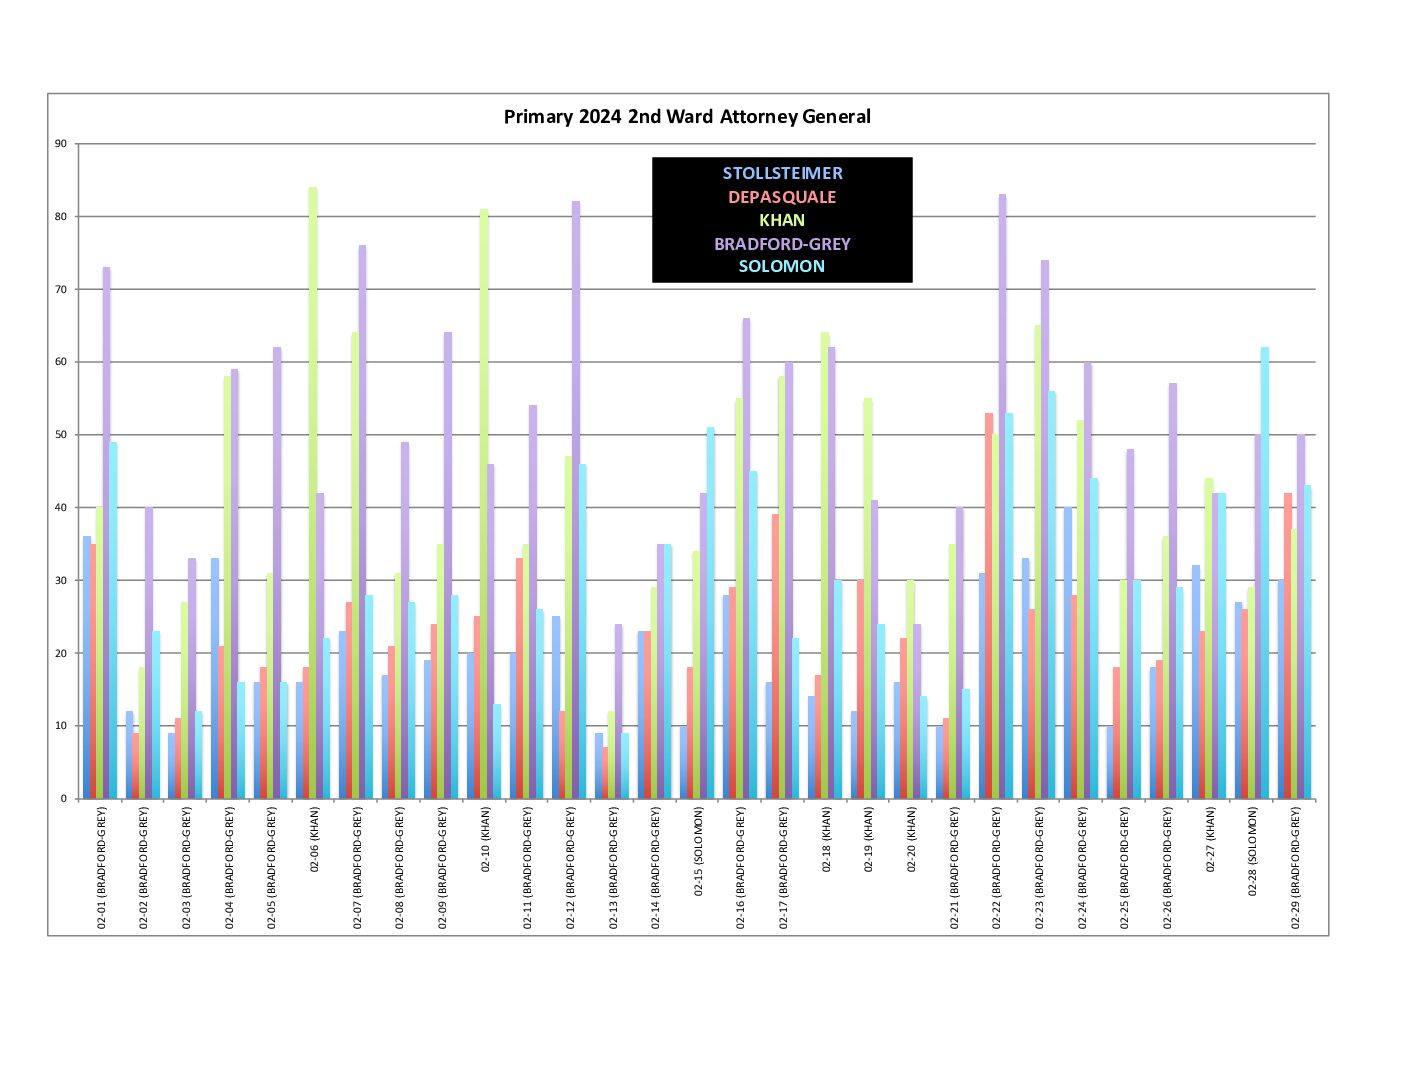
Six divisions carried our endorsed candidate for Attorney General, Joe Khan.
Thanks for reading!
Related Posts