The numbers are in!
Have you ever wondered how your Division performed in Philadelphia’s 2nd Ward when compared to other Divisions? (What’s my Division?) Well, the official voter file is in and we’ve crunched the numbers. (Don’t forget to check out how the Ward performed City-wide if you haven’t already.)
Important notes:
- All statistics have been rounded up or down. So, some numbers may appear to be a statistical dead heat.
- All charts reflect registered Democrats.
So, let’s dive in…
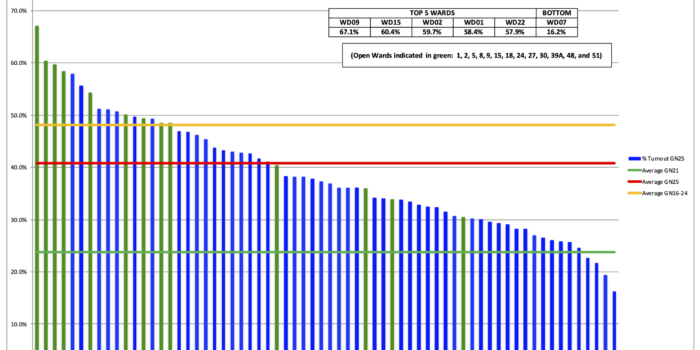
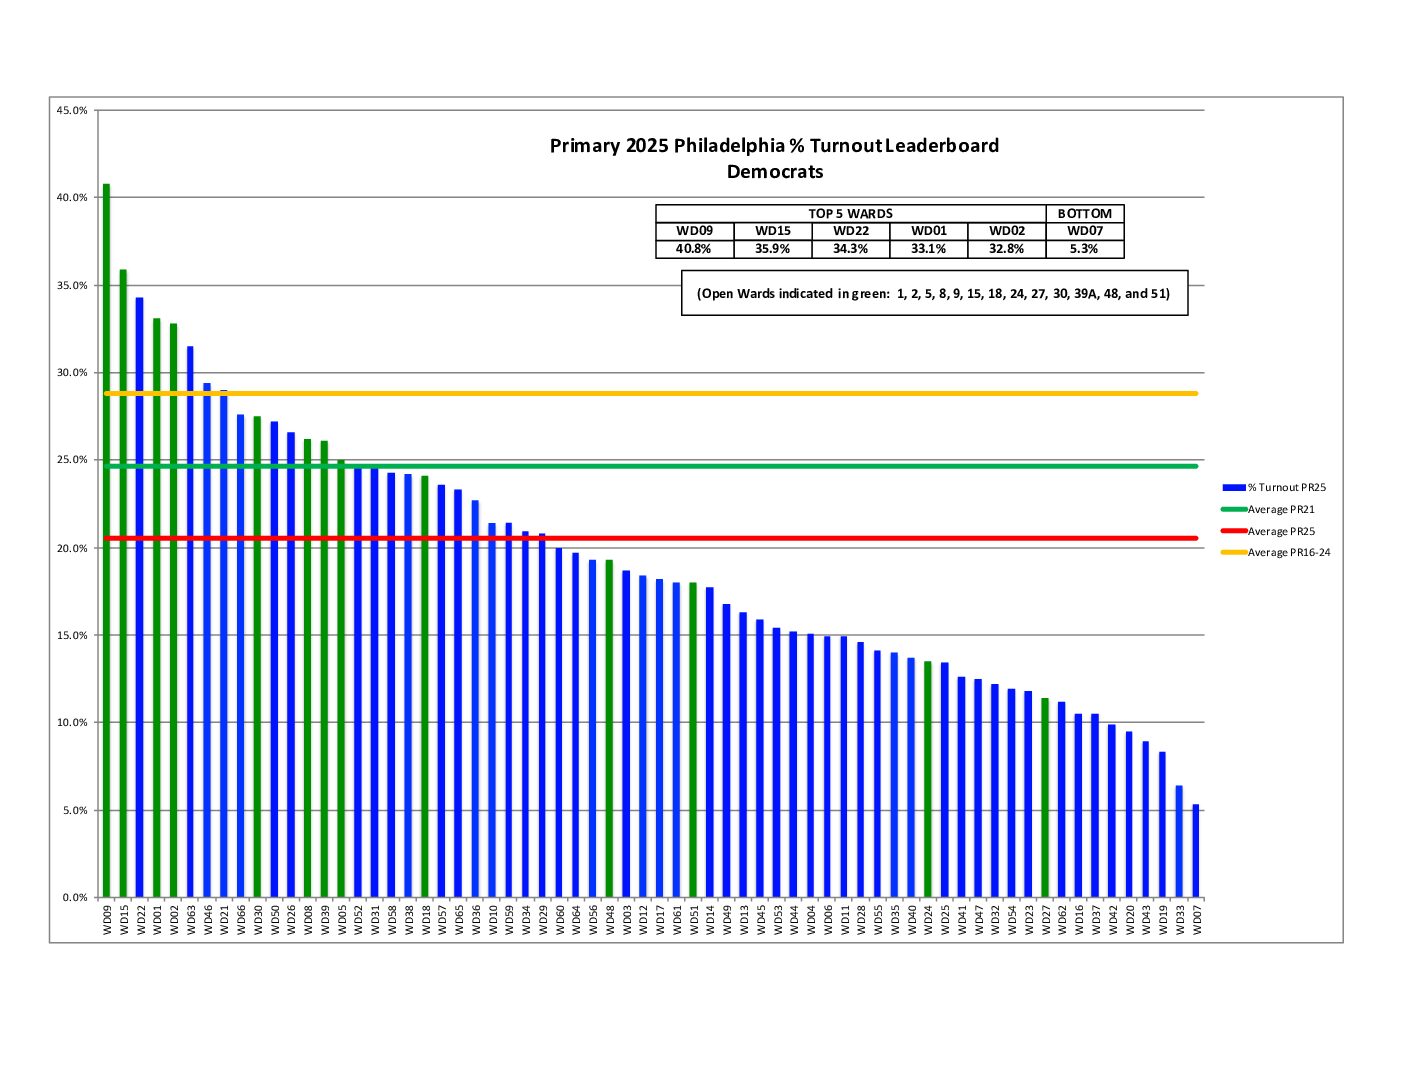
% Turnout

All but one Division beat the City average!
Turnout Voting Method comparison GN20 to GN21

You can see from the chart how the red mail voting method went down Ward wide. We showed a 32% decrease in mail-in voting for our Ward. Across the City, there was a 17% drop off in mail voting from 46% to 29%.
Anecdotally, when some of us talked with voters door to door, many people equated mail in voting with a bad thing they had to do because of the pandemic. Many wanted to vote in person as a marker of life getting back to normal. There is clearly some human behavior at work here.
% voted early

- Mail-in voting, Civilian overseas, Absentee
- Any voting method other than At Polls (AP)
% Mail-in Ballots spoiled

% Mail-in Ballots Unreturned

Comparison of General Elections 2017 through 2021

% Change in Turnout between GN20 and GN21

If we look at % Change in Turnout between GN20 and GN21, voter turnout was down. This is most likely due to the extremely important General election of 2020. The great news is that all Divisions beat the City’s average.
% Turnout of Inaccessible Doors mailing

For the second time ever, the 2nd Ward mailed endorsements to our inaccessible doors. These are homes or apartments our Committeepeople have flagged that they cannot canvass in person. We nearly matched our average turnout in this population, which is a sign that it worked.
% Change in turnout of Inaccessible Doors mailing from GN17 to GN21

Our inaccessible doors mailing resulted in a 41% increase in voting within this population!
(Don’t forget to check out how the Ward performed City-wide, if you haven’t already.)
Related Posts