The numbers are in!
Have you ever wondered how the 2nd Ward performed in Philadelphia when compared to other Wards? How about your particular Division? Well, the official voter file is in and we’ve crunched the numbers.
Important notes:
- All statistics have been rounded up or down to the nearest Whole number. So, some numbers may appear to be a statistical dead heat.
- All charts reflect registered Democrats.
So, let’s dive in…
% Turnout

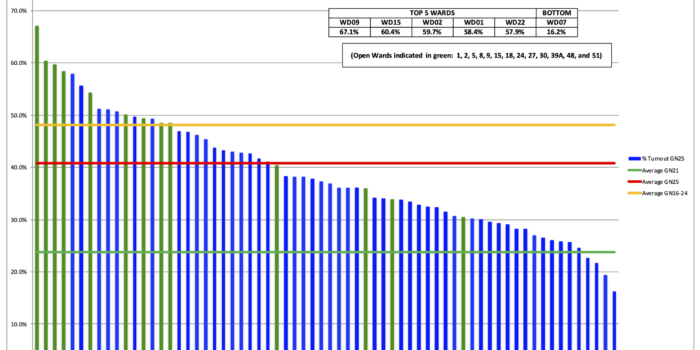
We beat the City % turnout average by 10%. We were within 1 percentage point of Ward 22, which came in 5th and within 5.5 percentage points of Ward 9, which came in 1st.
Turnout Voting Method
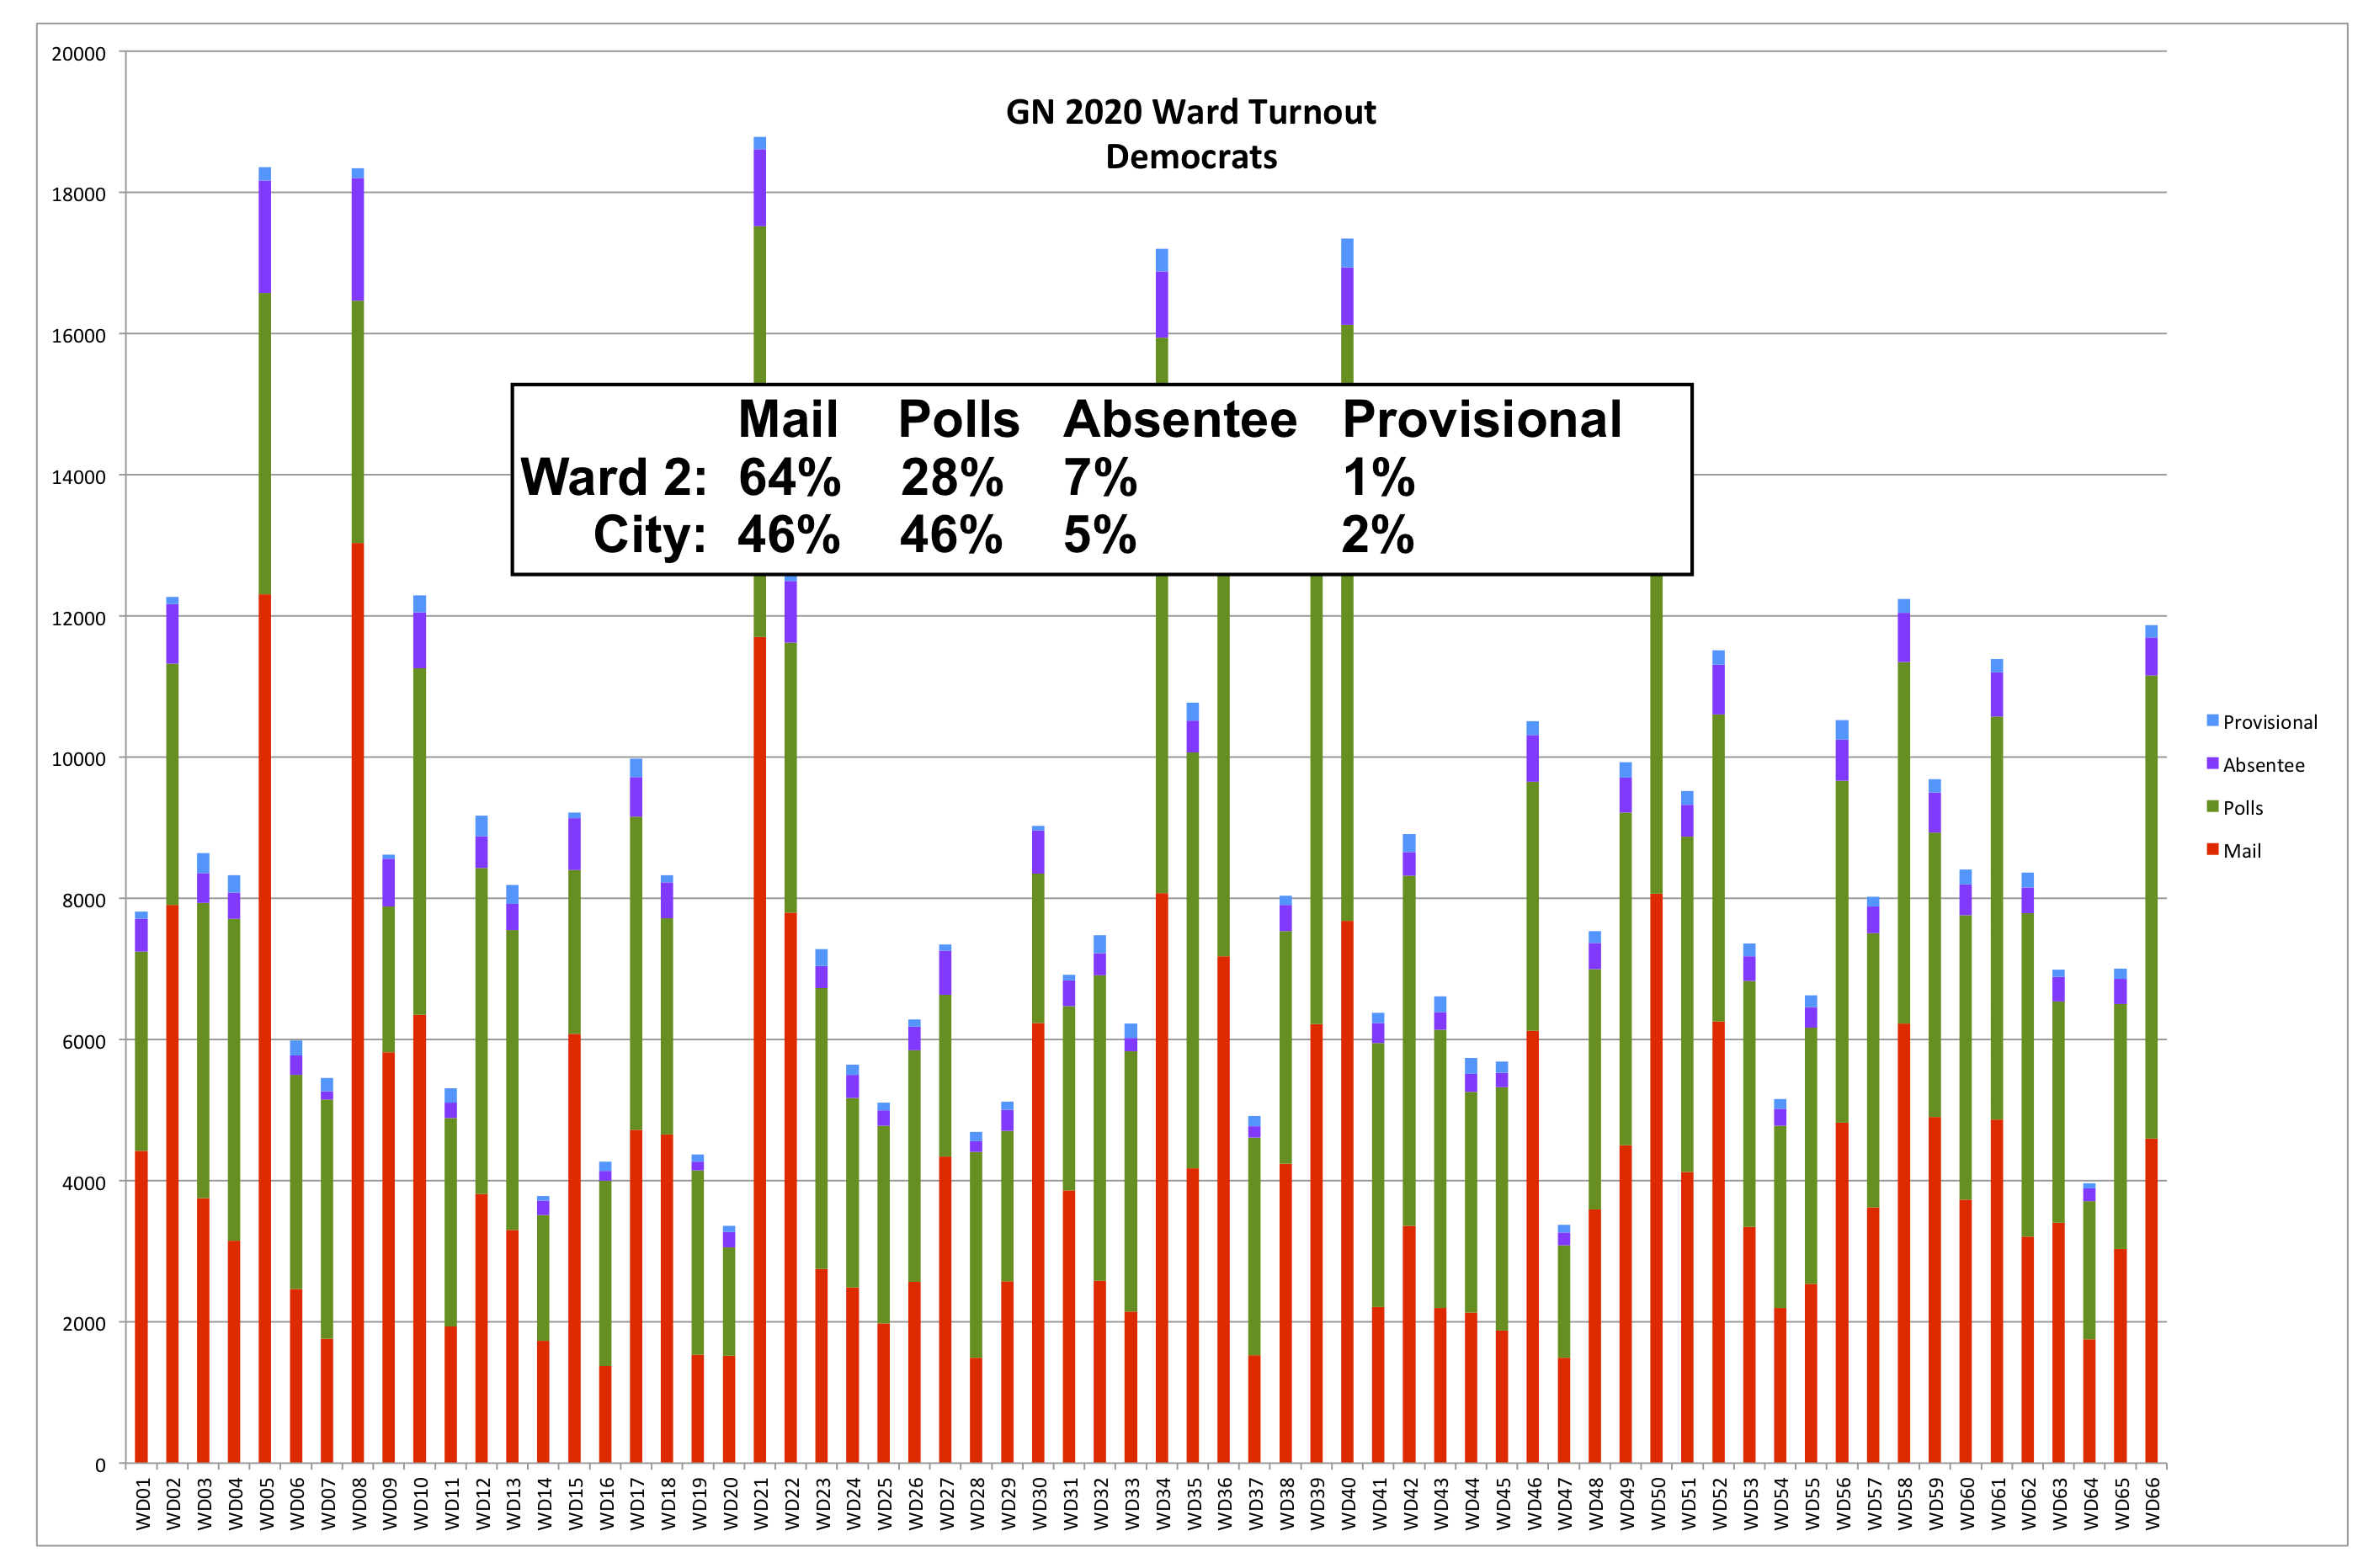
This shows the raw number of votes cast per Ward broken into Mail, At Polls, Absentee, and Provisional. We exceeded the City in terms of mail voting by 22%.
% voted early
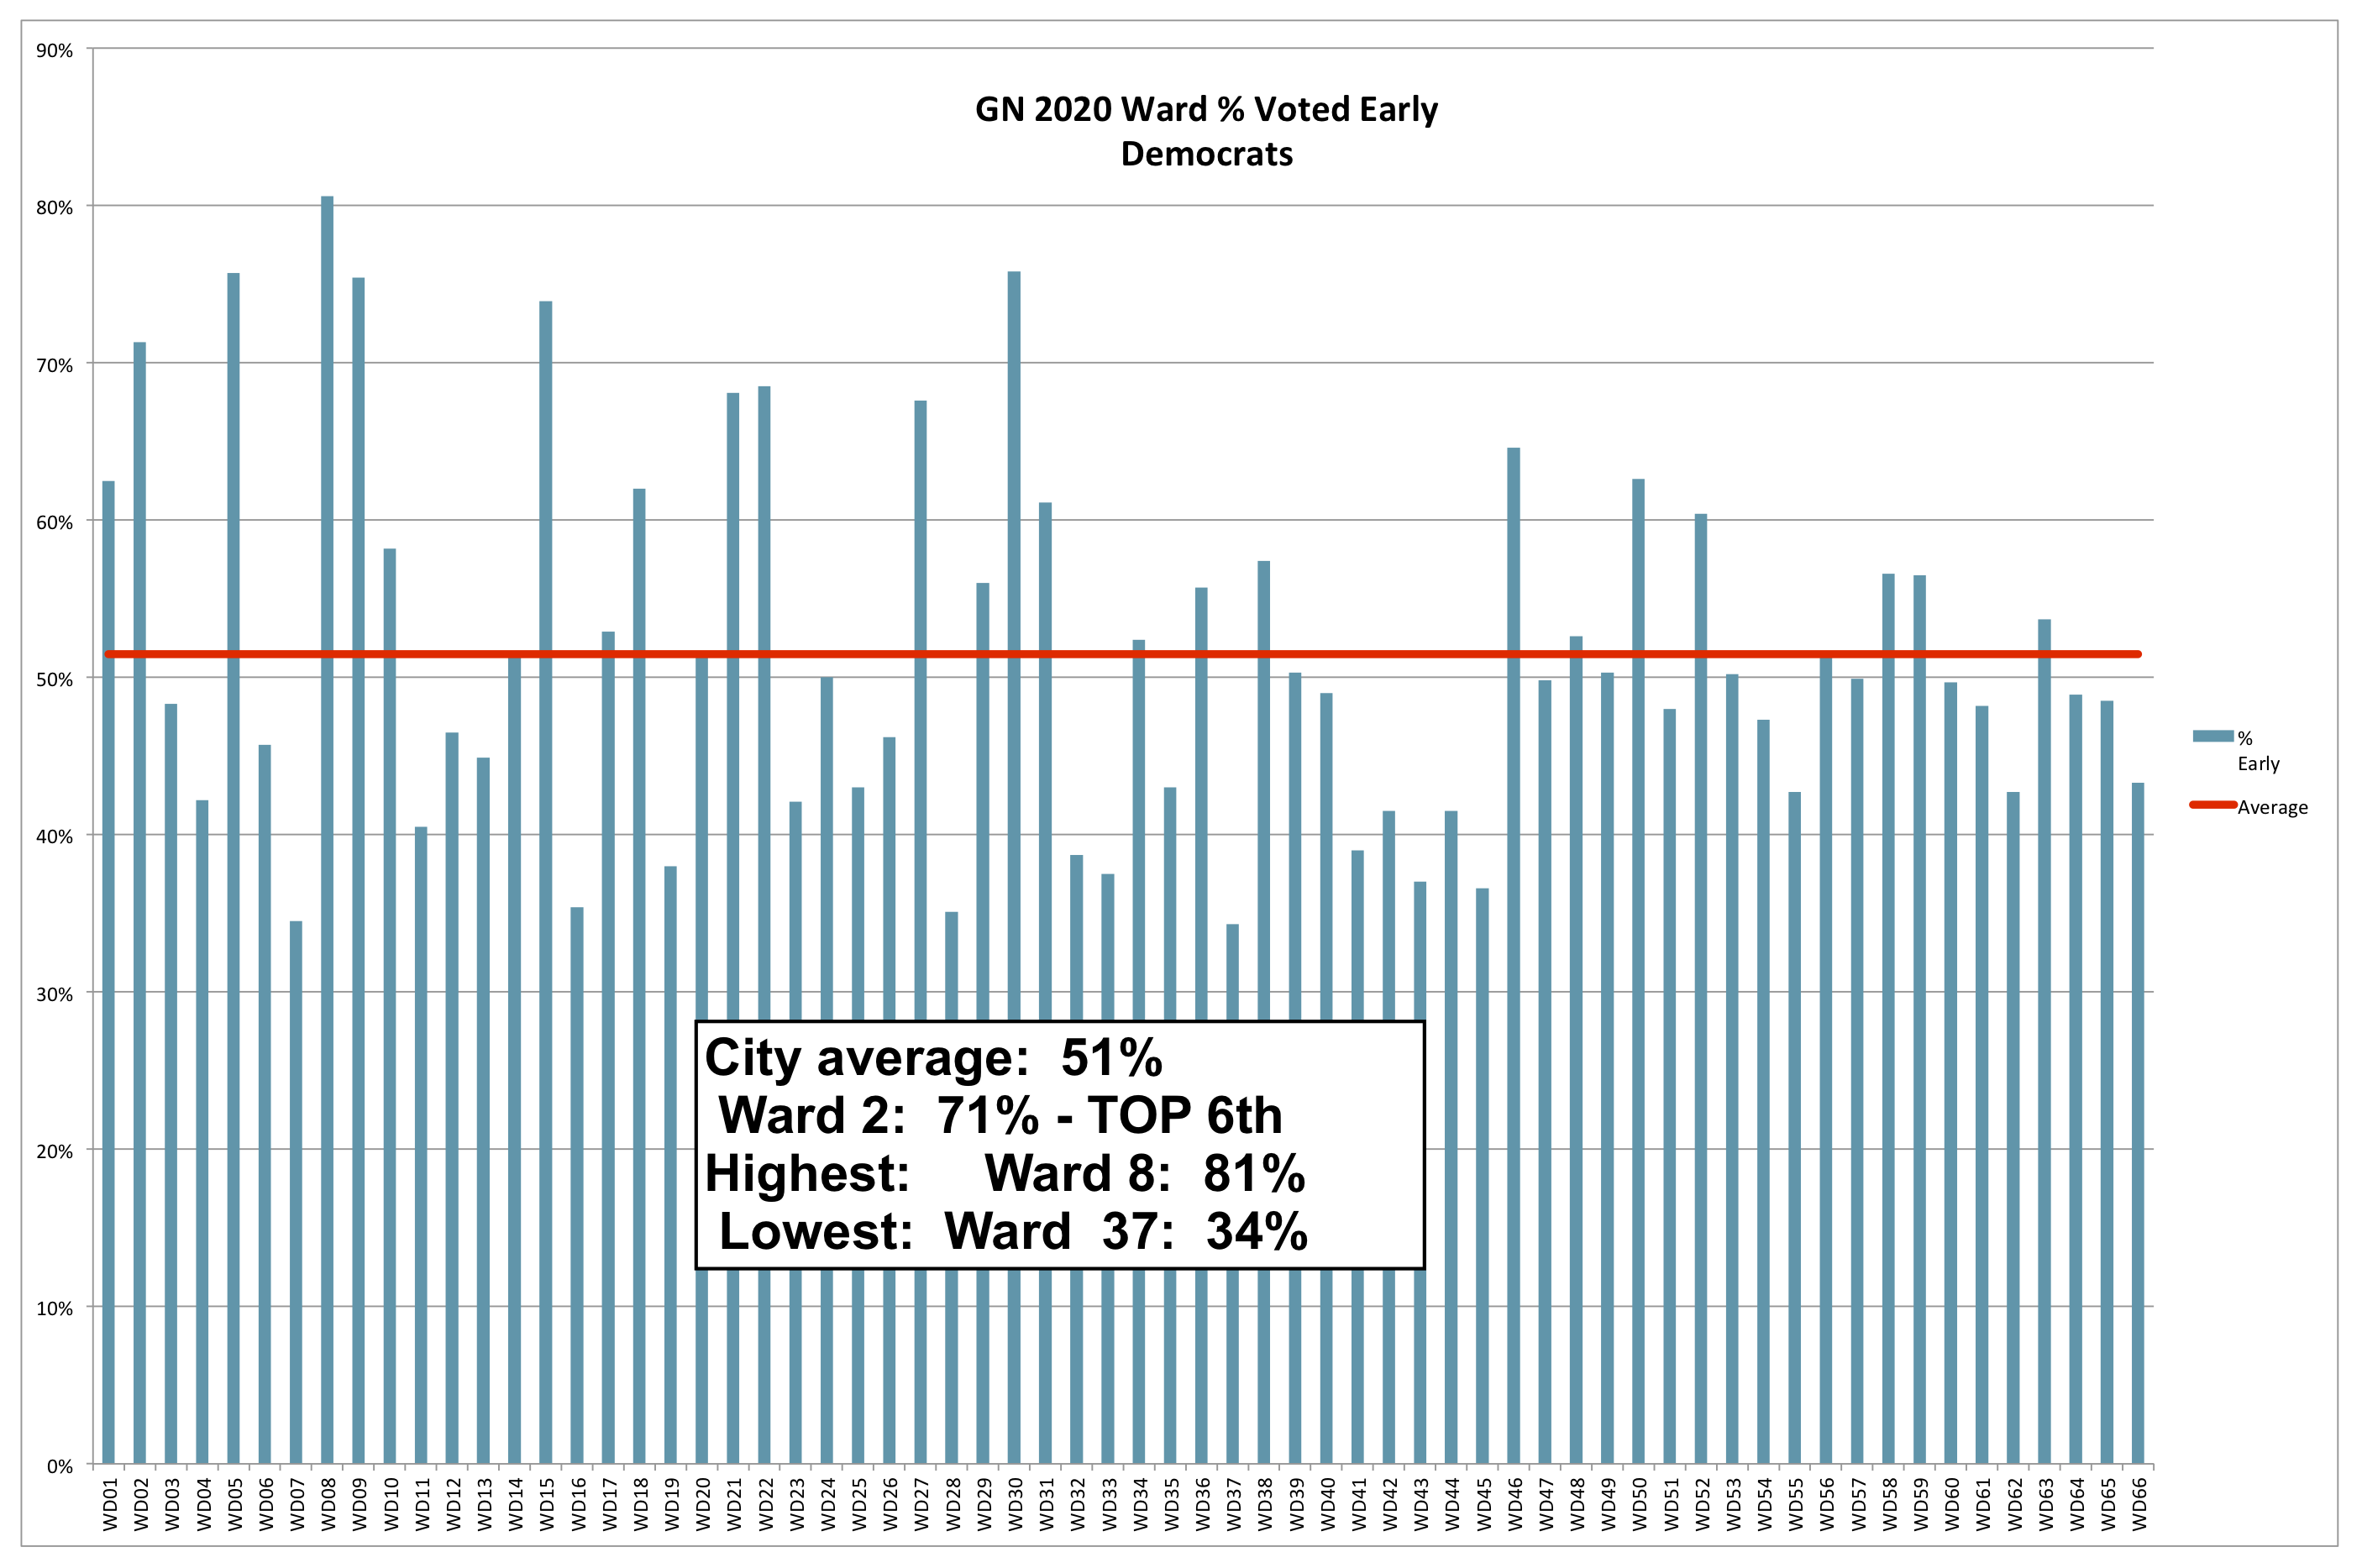
Voted early means:
- Mail-in voting, Civilian overseas, Absentee
- Any voting method other than At Polls (AP)
% Mail-in Ballots spoiled
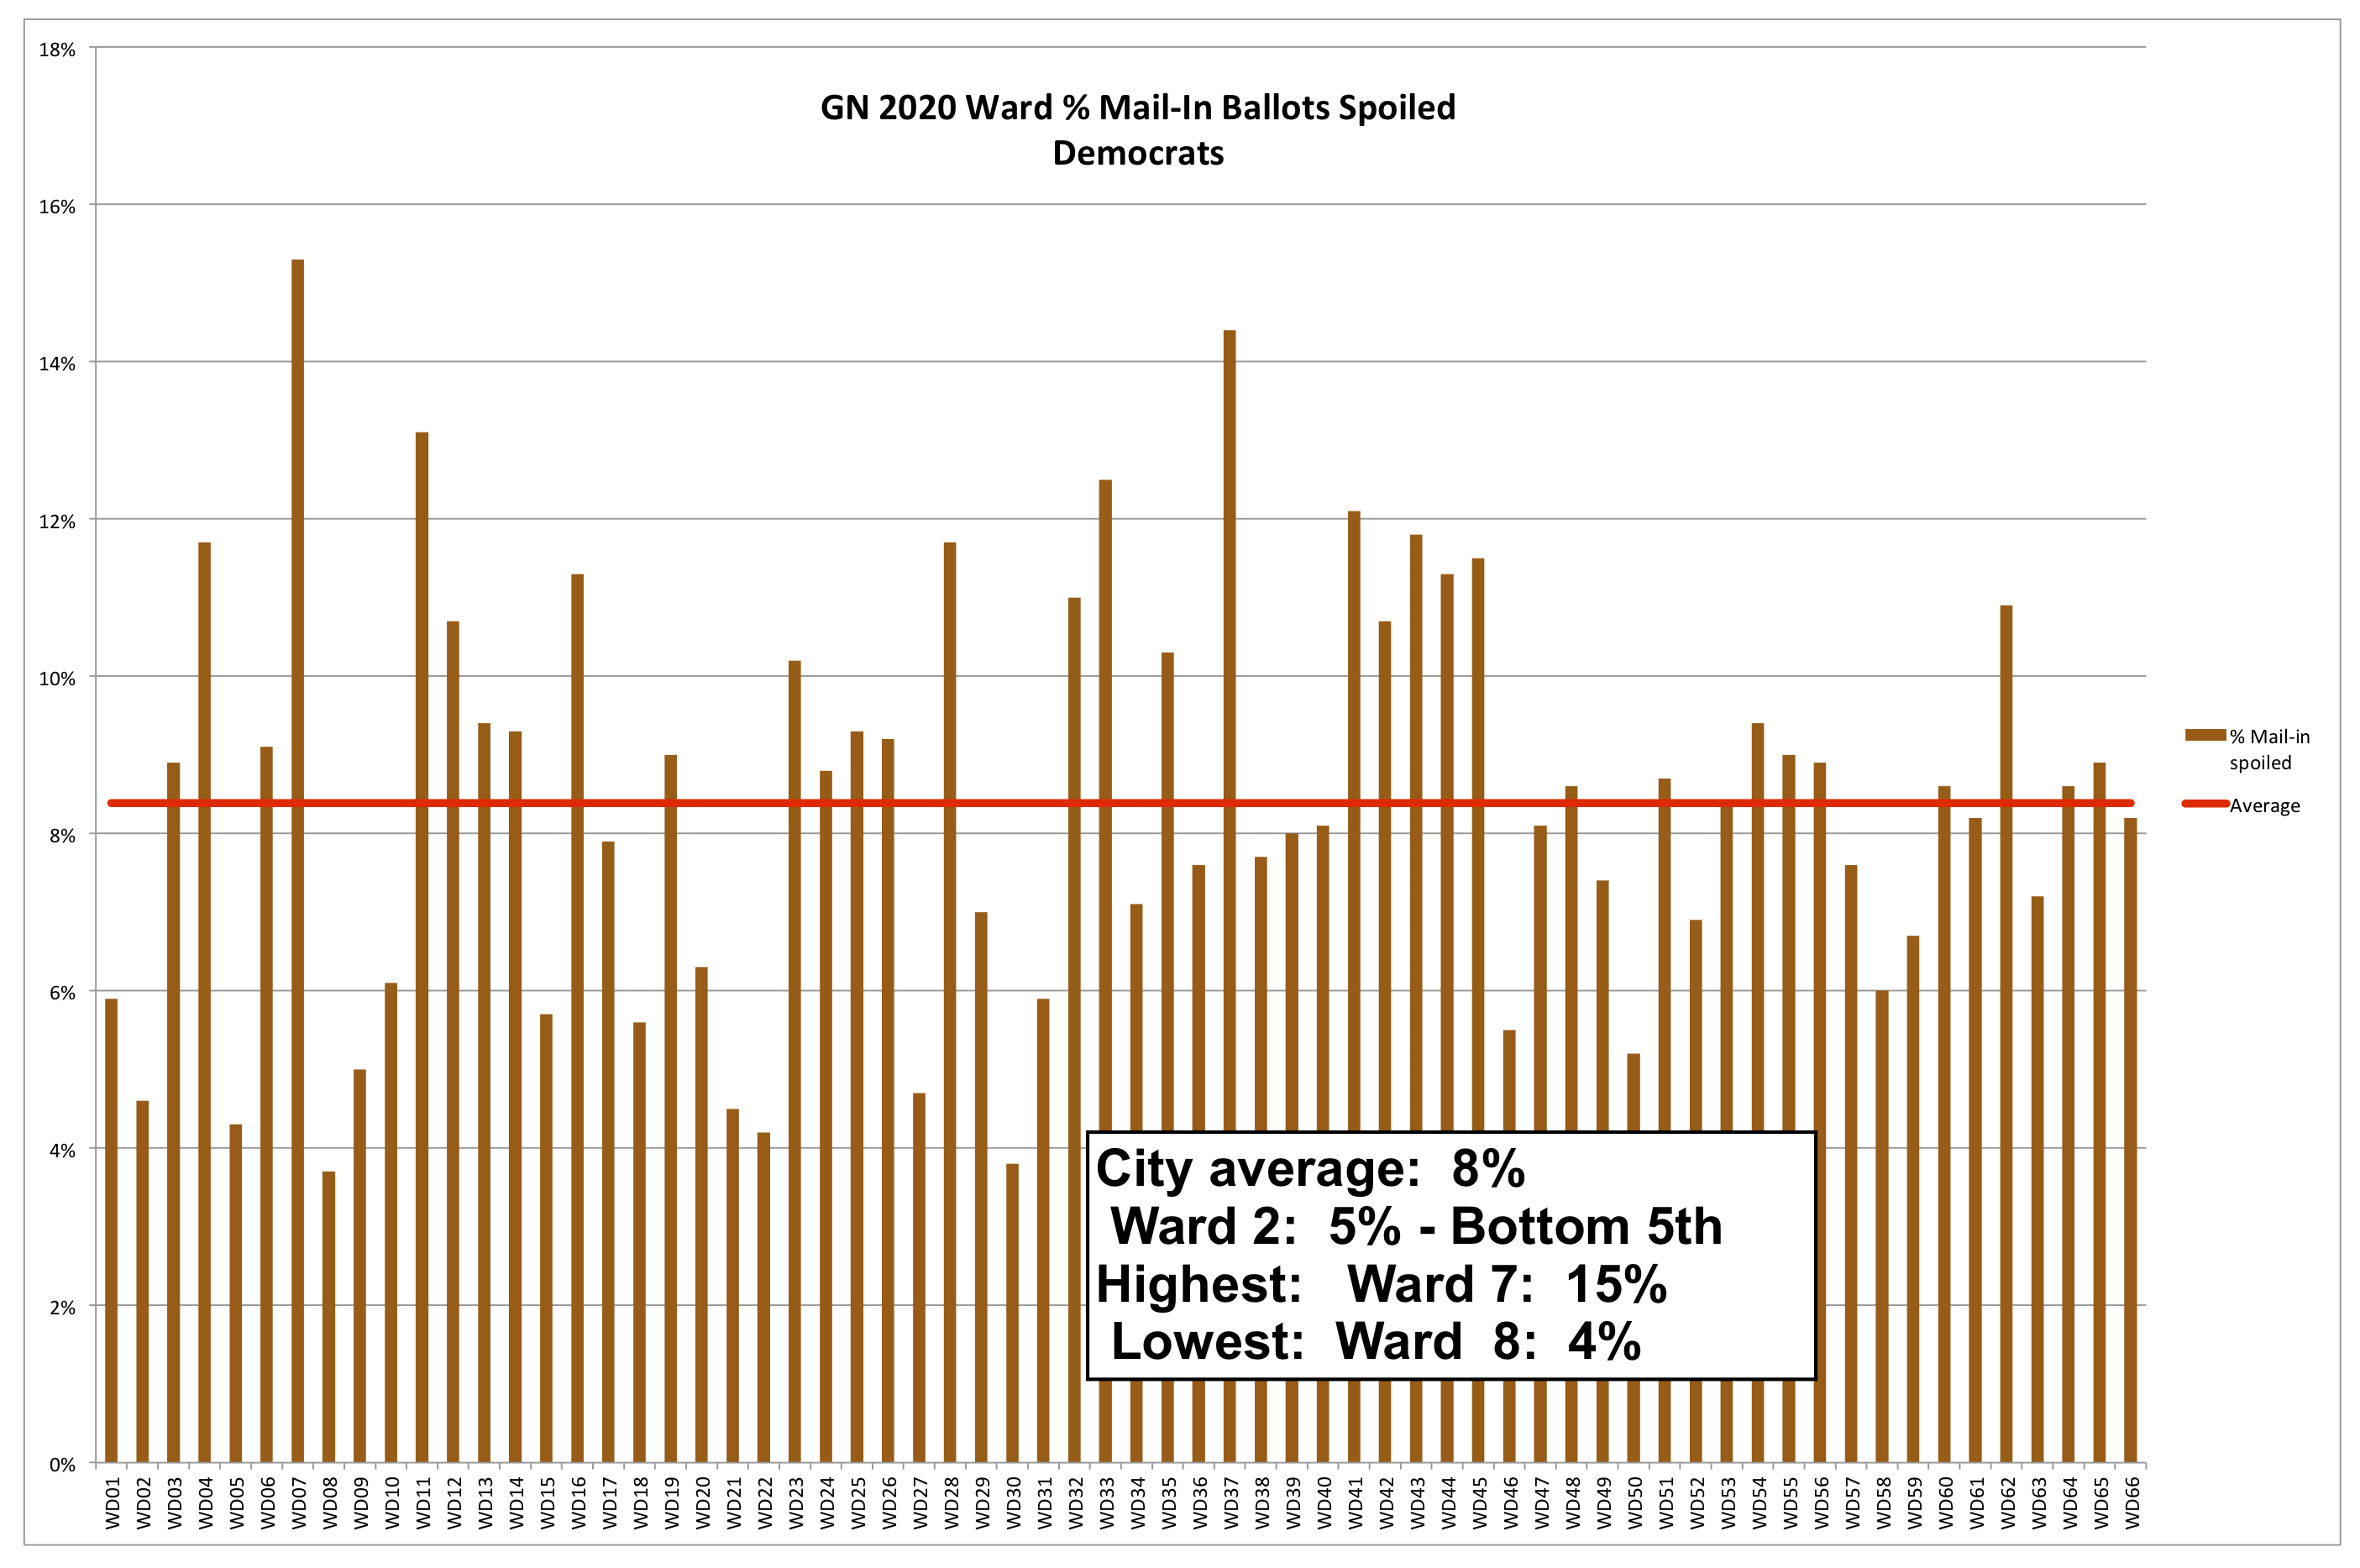
Spoiling a mail-in ballot means bringing it to the polls and voting in person, possibly even provisionally. But, despite the name, spoiled ballots are not a bad thing, per se. However, they can indicate distrust in the overall system of mail-in voting. We were within 1% of the Ward with the lowest number of spoiled mail-in ballots.
% Mail-in Ballots Unreturned
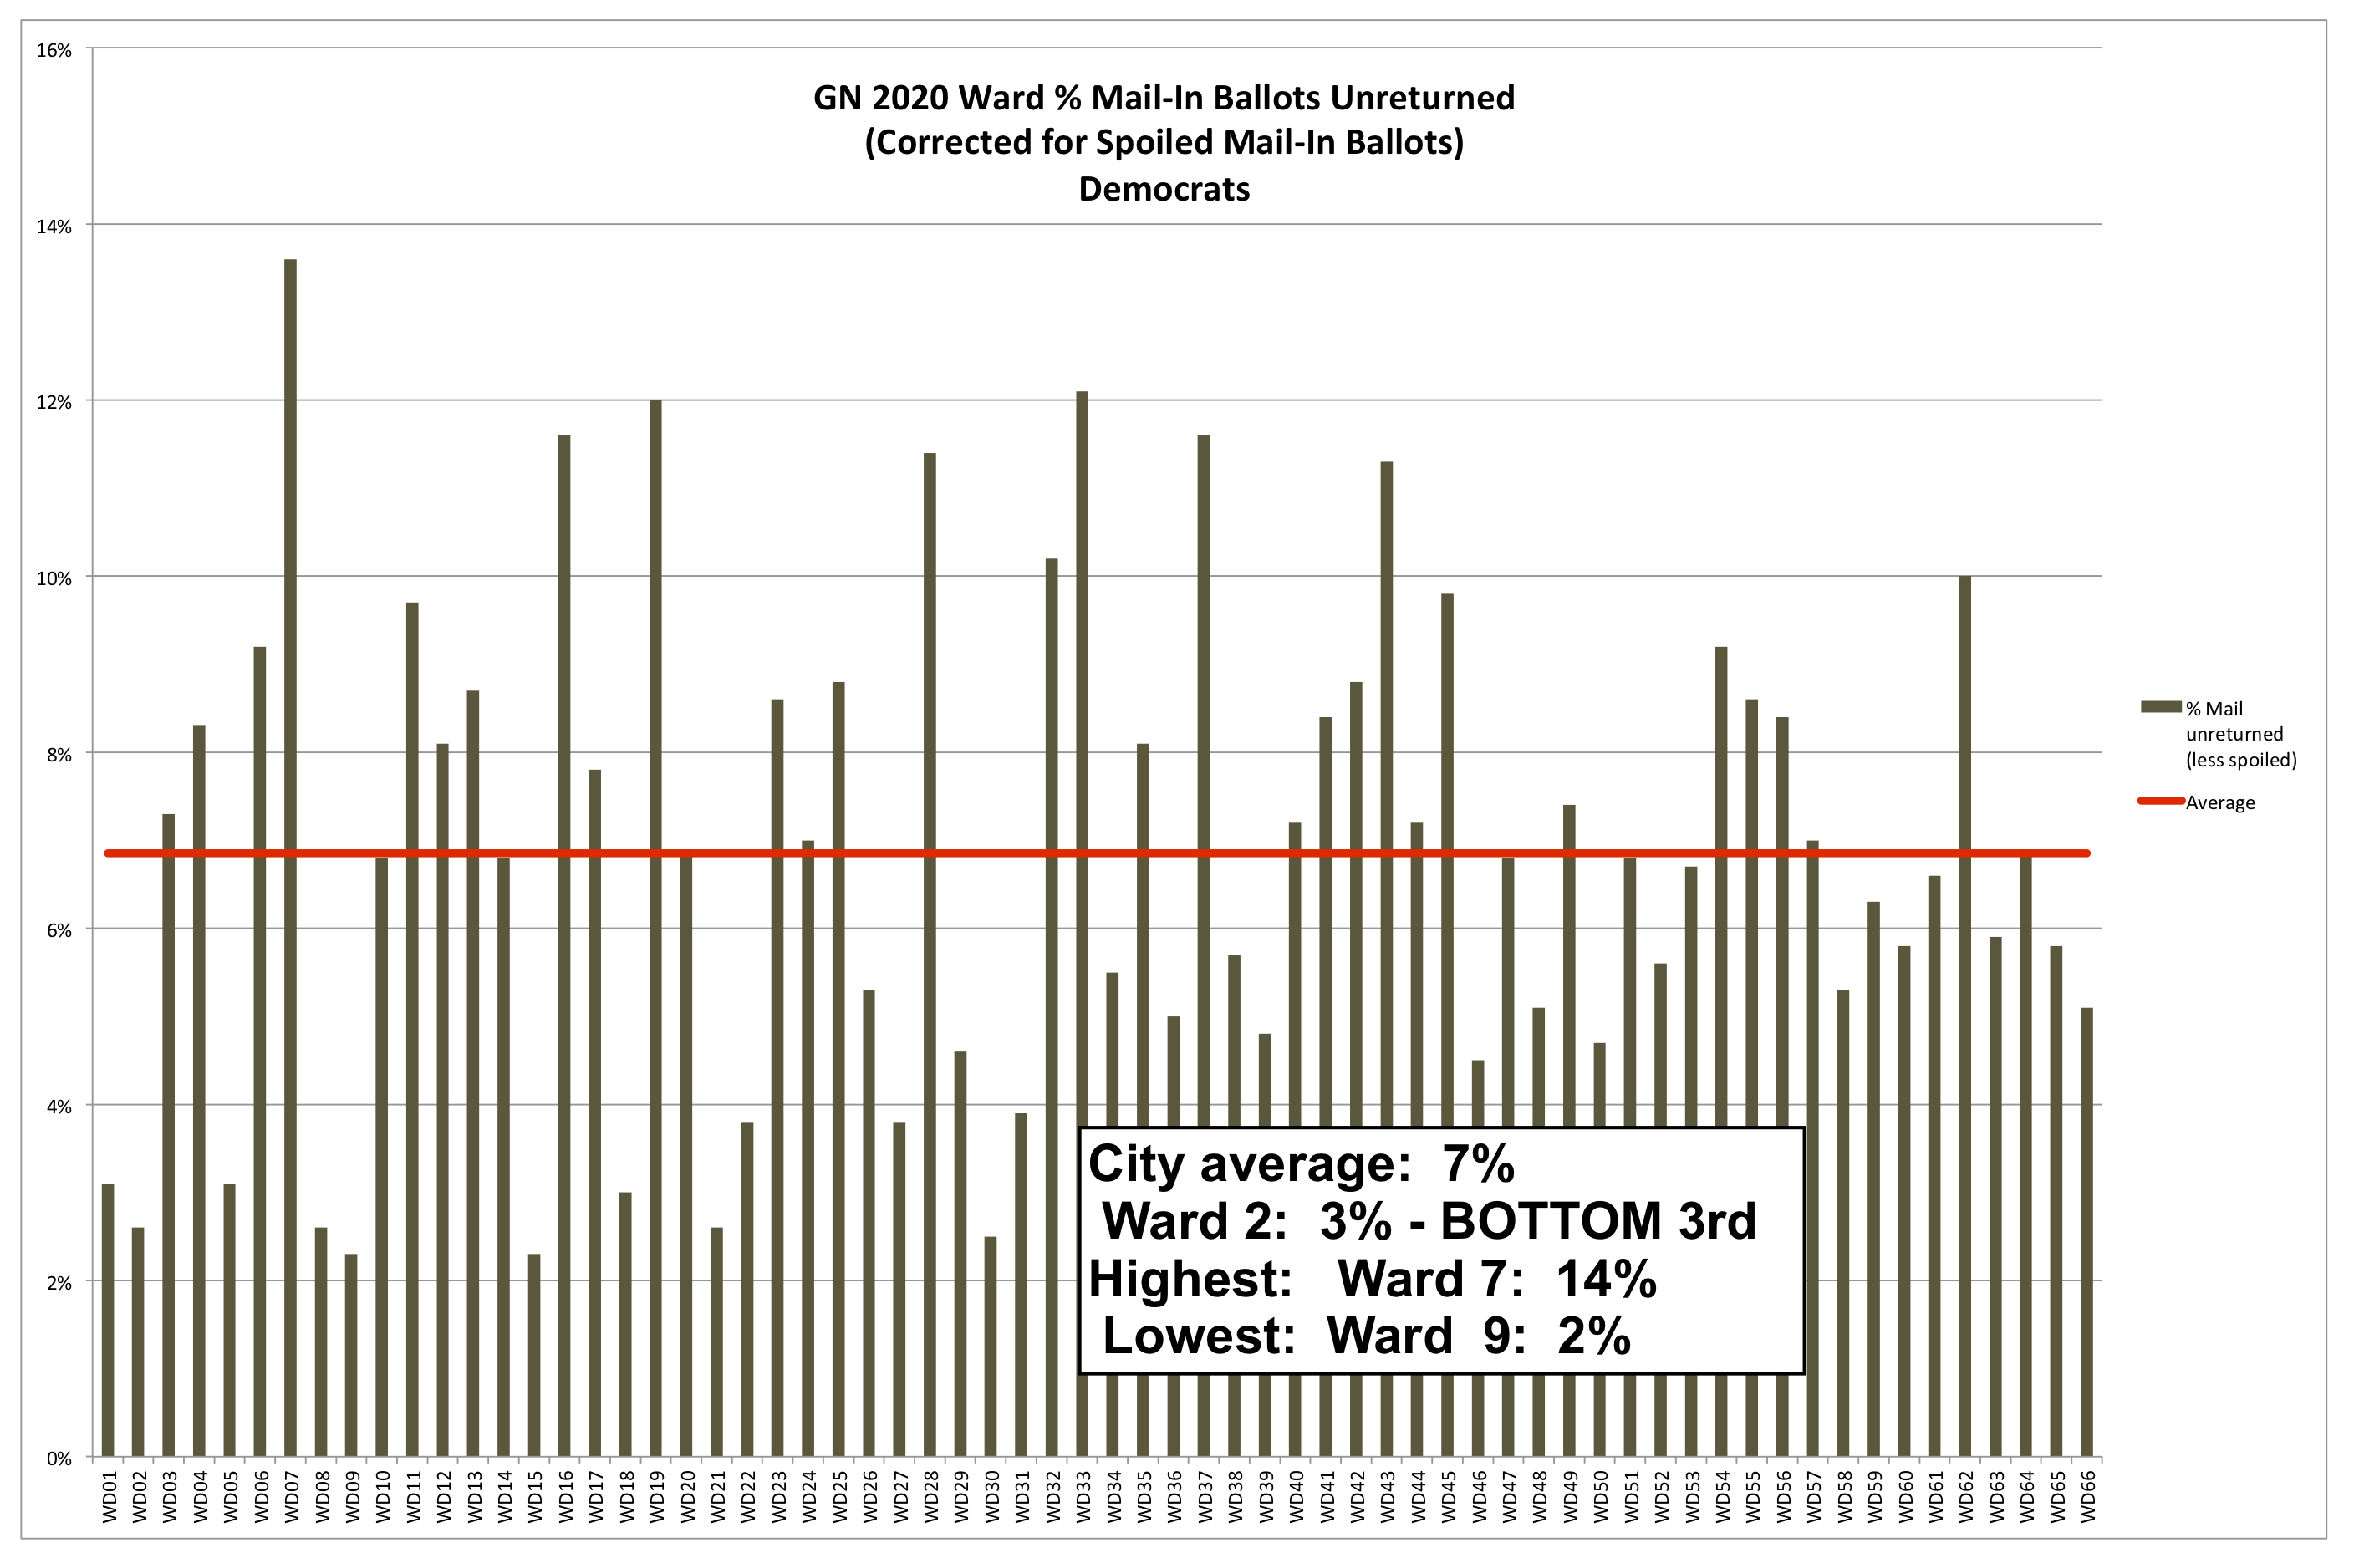
(This was corrected by subtracting the number of mail-in ballots that were spoiled.) We were within 1% of the Ward with the lowest number of unreturned mail-in ballots and a full 4% below the City average.
Comparison of General Elections 2016 and 2020
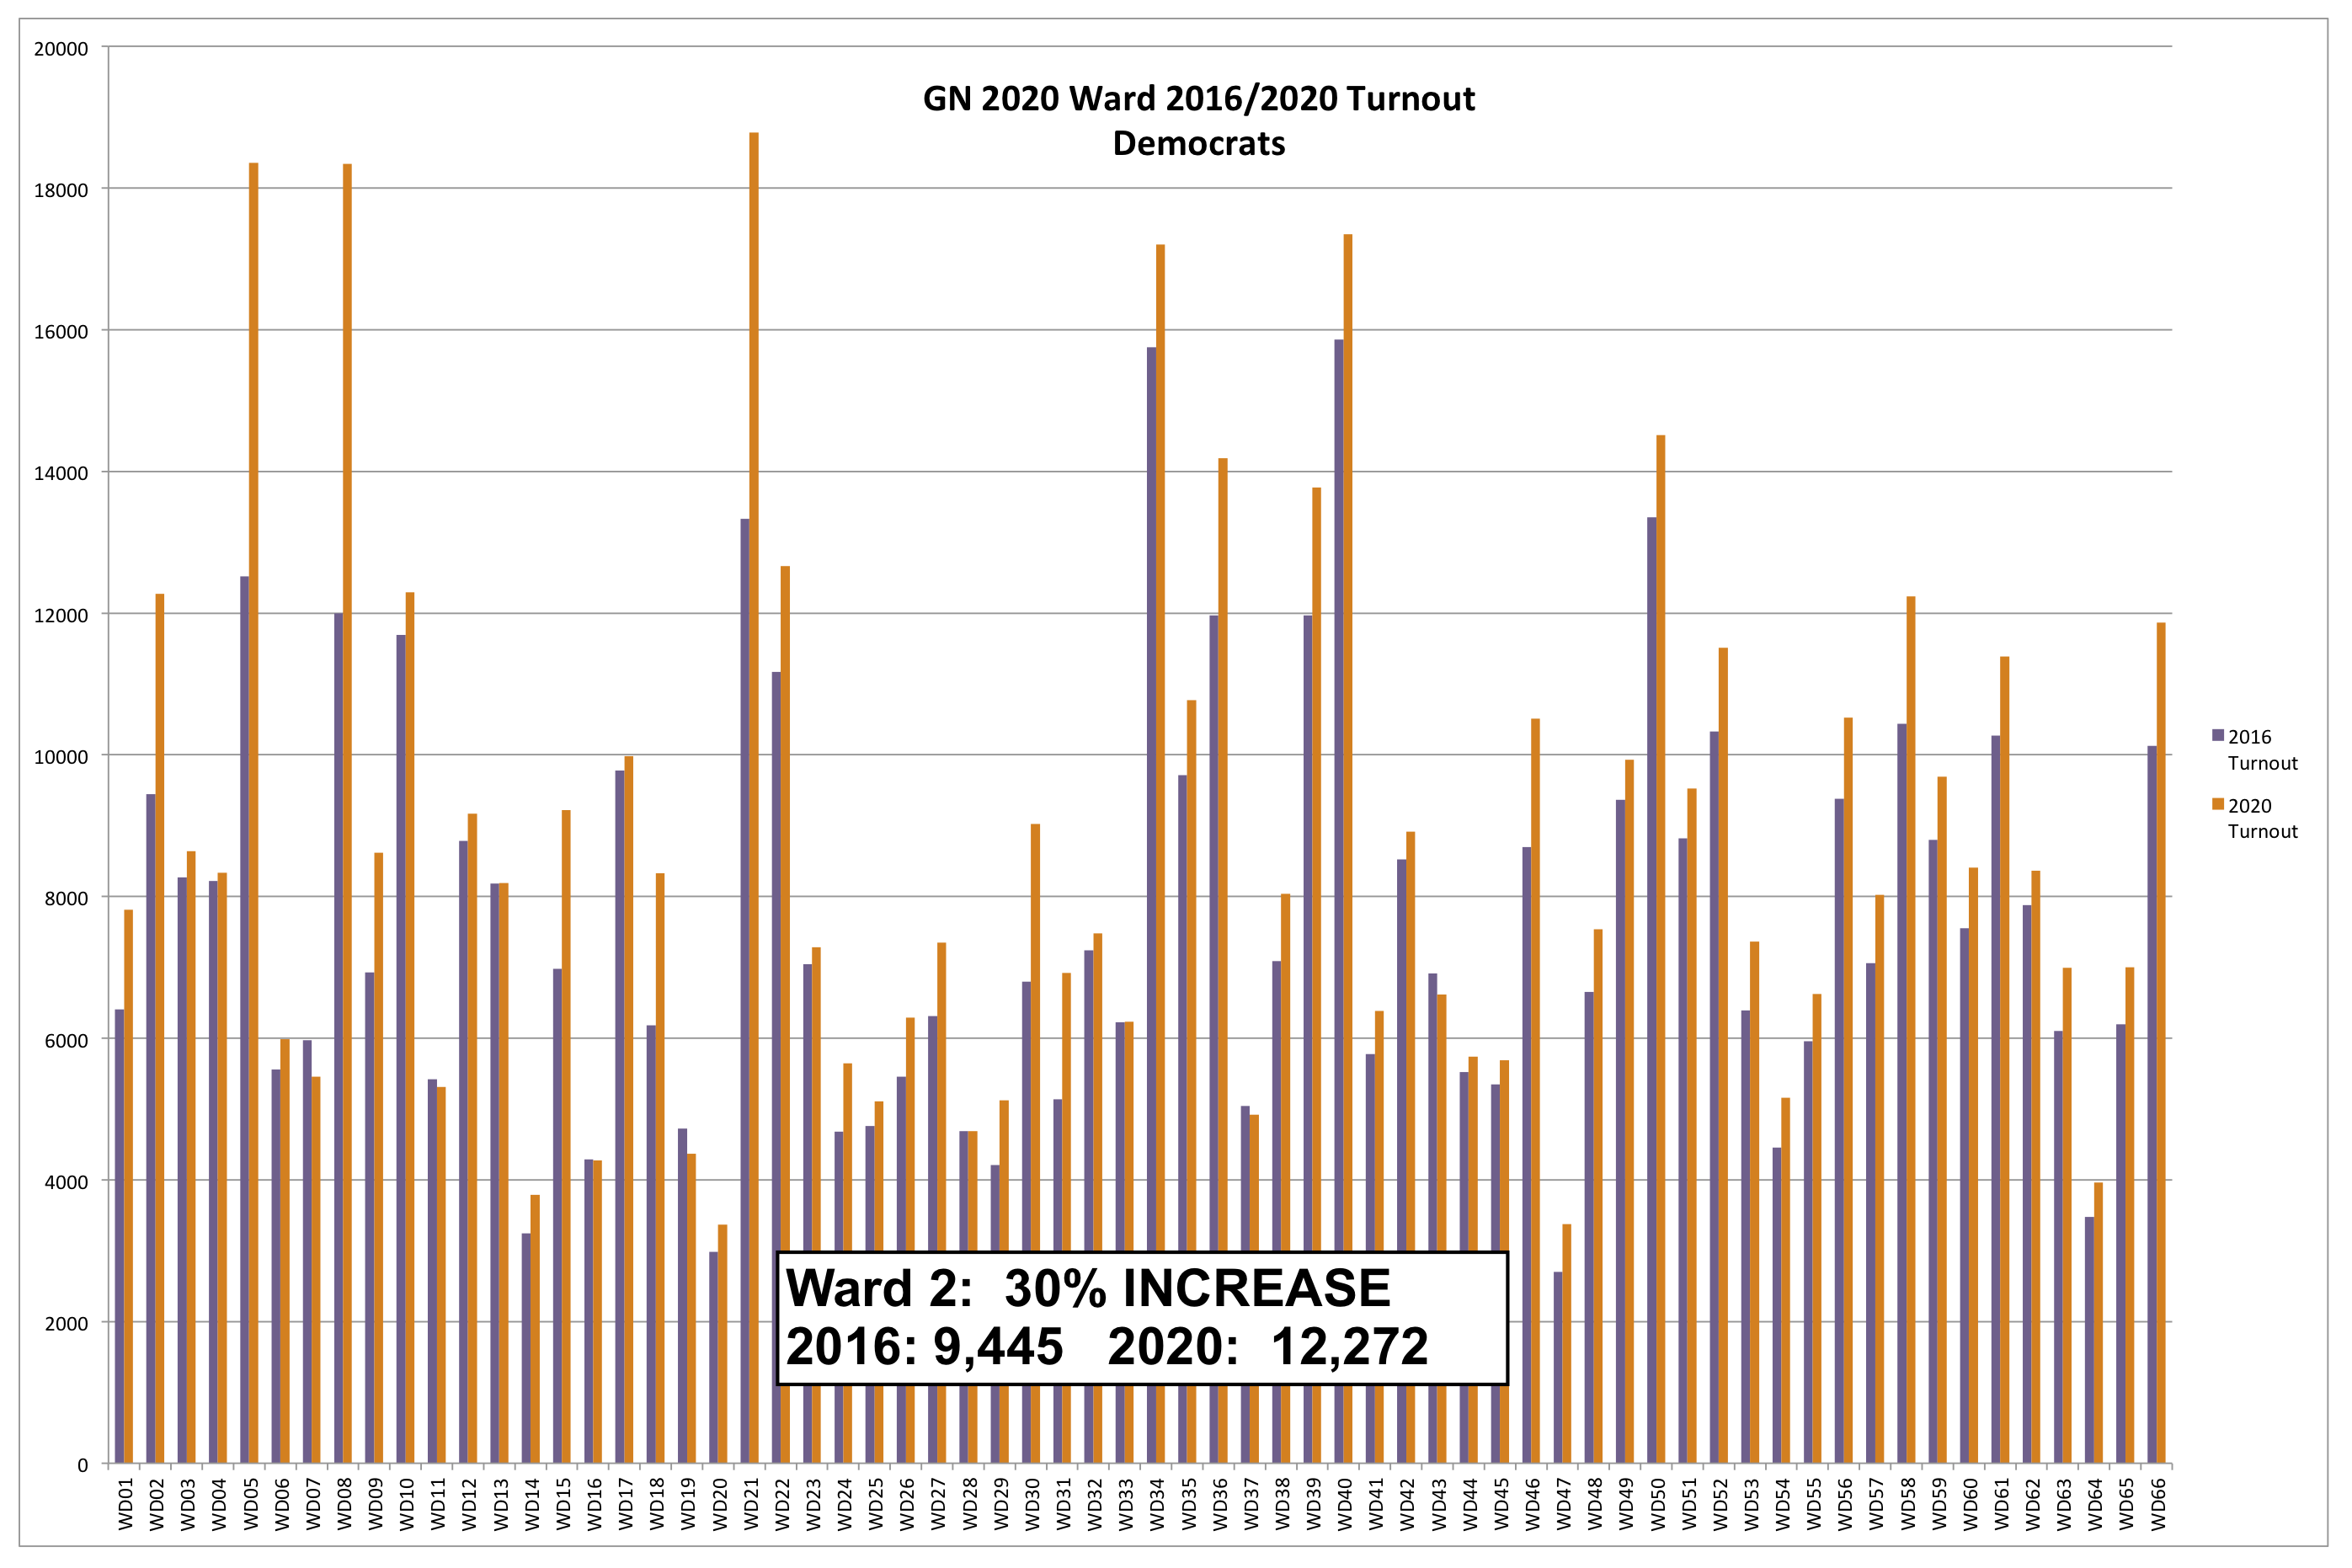
All but seven Wards showed an increase in voter turnout. But, these are just raw numbers. The next chart shows how we did compared to other Wards and the City average.
% Change in Turnout between 2016 and 2020
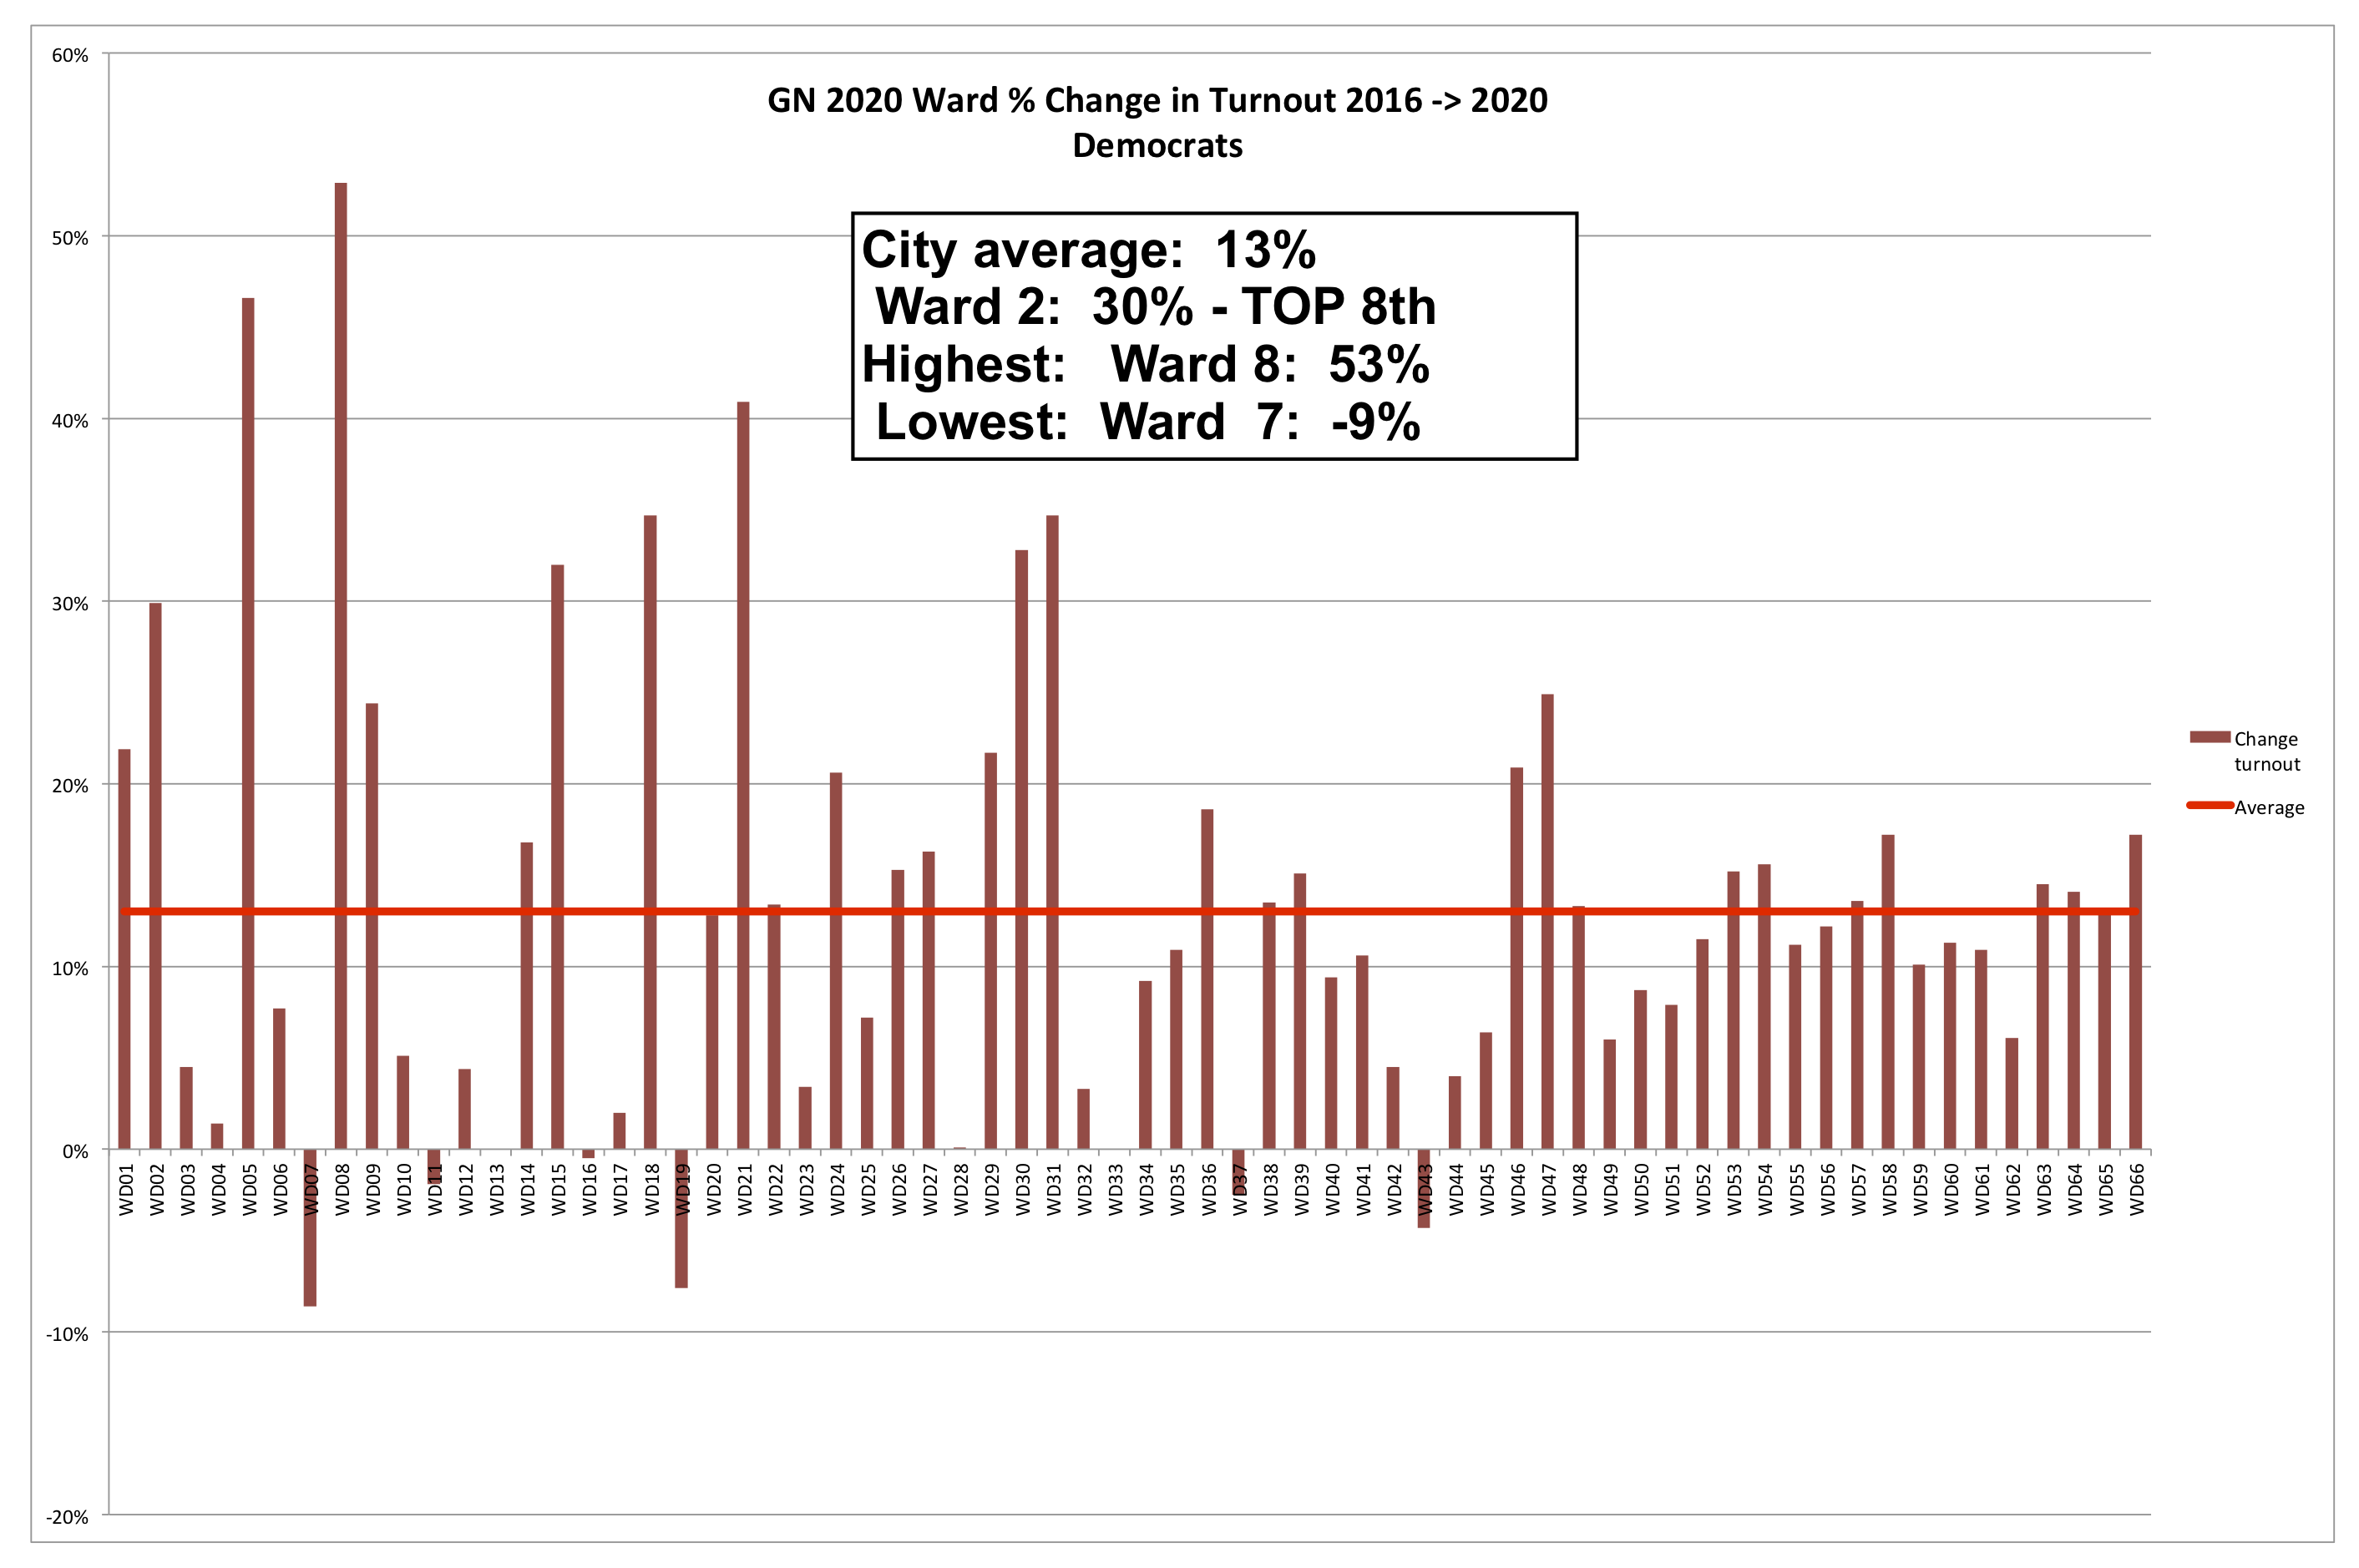
We beat the City average by 17%! Now, check out how the different Divisions stacked up within the 2nd Ward.
Related Posts